PacerTrendpilottm PTEU full analysis,charts,indicators,moving averages,SMA,DMA,EMA,ADX,MACD,RSIPacer Trendpilottm PTEU WideScreen charts, DMA,SMA,EMA technical analysis, forecast prediction, by indicators ADX,MACD,RSI,CCI AMEX stock exchange
Daily price and charts and targets PacerTrendpilottm Strong Daily Stock price targets for PacerTrendpilottm PTEU are 30.18 and 30.23 | Daily Target 1 | 30.17 | | Daily Target 2 | 30.18 | | Daily Target 3 | 30.216666666667 | | Daily Target 4 | 30.23 | | Daily Target 5 | 30.27 |
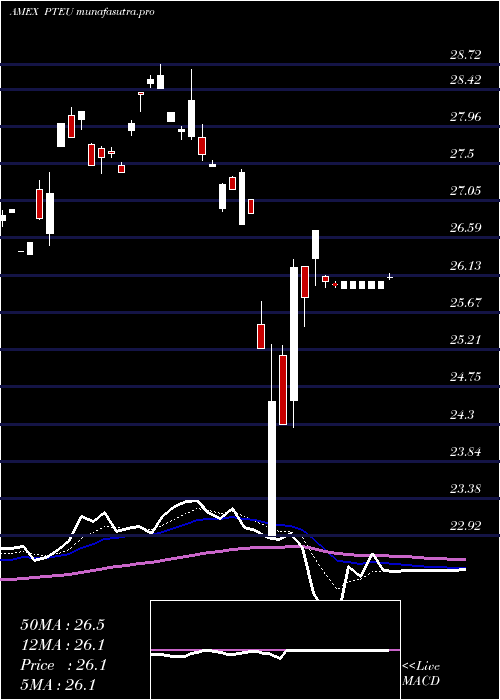
Daily price and volume Pacer Trendpilottm
| Date |
Closing |
Open |
Range |
Volume |
Fri 24 October 2025 |
30.20 (0%) |
30.25 |
30.20 - 30.25 |
0.8606 times |
Thu 23 October 2025 |
30.20 (0.53%) |
30.24 |
30.20 - 30.25 |
0.5745 times |
Wed 22 October 2025 |
30.04 (-0.46%) |
30.15 |
29.93 - 30.19 |
1.8297 times |
Tue 21 October 2025 |
30.18 (-0.36%) |
30.20 |
30.18 - 30.20 |
0.5566 times |
Mon 20 October 2025 |
30.29 (0.5%) |
30.28 |
30.28 - 30.43 |
0.4453 times |
Fri 17 October 2025 |
30.14 (0.17%) |
30.13 |
29.99 - 30.14 |
1.3916 times |
Thu 16 October 2025 |
30.09 (0.97%) |
29.91 |
29.91 - 30.20 |
1.5586 times |
Wed 15 October 2025 |
29.80 (-0.03%) |
29.83 |
29.80 - 29.86 |
0.4453 times |
Tue 14 October 2025 |
29.81 (0.61%) |
29.28 |
29.28 - 29.86 |
1.0019 times |
Mon 13 October 2025 |
29.63 (-1%) |
29.74 |
29.48 - 29.75 |
1.3359 times |
Tue 07 October 2025 |
29.93 (-1.16%) |
29.99 |
29.89 - 30.01 |
0.7236 times |
Weekly price and charts PacerTrendpilottm Strong weekly Stock price targets for PacerTrendpilottm PTEU are 29.82 and 30.32 | Weekly Target 1 | 29.69 | | Weekly Target 2 | 29.94 | | Weekly Target 3 | 30.186666666667 | | Weekly Target 4 | 30.44 | | Weekly Target 5 | 30.69 |
Weekly price and volumes for Pacer Trendpilottm
| Date |
Closing |
Open |
Range |
Volume |
Fri 24 October 2025 |
30.20 (0.2%) |
30.28 |
29.93 - 30.43 |
0.8268 times |
Fri 17 October 2025 |
30.14 (0.7%) |
29.74 |
29.28 - 30.20 |
1.1111 times |
Tue 07 October 2025 |
29.93 (-1.71%) |
30.15 |
29.89 - 30.28 |
0.3329 times |
Fri 03 October 2025 |
30.45 (3.15%) |
29.71 |
29.60 - 30.45 |
0.8038 times |
Fri 26 September 2025 |
29.52 (0.27%) |
29.38 |
29.10 - 29.74 |
1.4563 times |
Fri 19 September 2025 |
29.44 (0.48%) |
29.39 |
29.31 - 29.67 |
1.6612 times |
Fri 12 September 2025 |
29.30 (1.81%) |
29.03 |
28.98 - 29.34 |
1.6289 times |
Fri 05 September 2025 |
28.78 (-1.07%) |
28.60 |
28.28 - 28.86 |
1.2513 times |
Fri 29 August 2025 |
29.09 (0%) |
29.00 |
29.00 - 29.09 |
0.0971 times |
Fri 29 August 2025 |
29.09 (-2.19%) |
29.38 |
28.65 - 29.38 |
0.8306 times |
Fri 22 August 2025 |
29.74 (0.71%) |
29.28 |
29.22 - 29.74 |
1.8338 times |

Monthly price and charts PacerTrendpilottm Strong monthly Stock price targets for PacerTrendpilottm PTEU are 29.74 and 30.91 | Monthly Target 1 | 28.81 | | Monthly Target 2 | 29.5 | | Monthly Target 3 | 29.976666666667 | | Monthly Target 4 | 30.67 | | Monthly Target 5 | 31.15 |
Monthly price and volumes Pacer Trendpilottm
| Date |
Closing |
Open |
Range |
Volume |
Fri 24 October 2025 |
30.20 (0.97%) |
30.03 |
29.28 - 30.45 |
0.2579 times |
Tue 30 September 2025 |
29.91 (2.82%) |
28.60 |
28.28 - 29.91 |
0.5637 times |
Fri 29 August 2025 |
29.09 (3.63%) |
27.76 |
27.67 - 29.74 |
0.4865 times |
Thu 31 July 2025 |
28.07 (-2.33%) |
28.39 |
27.77 - 29.51 |
0.5016 times |
Mon 30 June 2025 |
28.74 (2.13%) |
28.23 |
27.64 - 29.99 |
0.915 times |
Fri 30 May 2025 |
28.14 (5.35%) |
26.43 |
26.43 - 28.67 |
2.315 times |
Wed 30 April 2025 |
26.71 (-1.98%) |
27.34 |
22.92 - 27.43 |
1.9528 times |
Mon 31 March 2025 |
27.25 (2.71%) |
27.19 |
26.49 - 28.72 |
1.1295 times |
Fri 28 February 2025 |
26.53 (3.79%) |
24.89 |
24.81 - 27.02 |
0.4054 times |
Fri 31 January 2025 |
25.56 (6.77%) |
23.95 |
23.71 - 26.06 |
1.4726 times |
Tue 31 December 2024 |
23.94 (-4.81%) |
25.45 |
23.86 - 25.79 |
0.707 times |

DMA SMA EMA moving averages of Pacer Trendpilottm PTEU
DMA (daily moving average) of Pacer Trendpilottm PTEU
| DMA period | DMA value | | 5 day DMA | 30.18 | | 12 day DMA | 30.05 | | 20 day DMA | 29.97 | | 35 day DMA | 29.65 | | 50 day DMA | 29.54 | | 100 day DMA | 29.04 | | 150 day DMA | 28.35 | | 200 day DMA | 27.8 | EMA (exponential moving average) of Pacer Trendpilottm PTEU
| EMA period | EMA current | EMA prev | EMA prev2 | | 5 day EMA | 30.15 | 30.13 | 30.1 | | 12 day EMA | 30.07 | 30.05 | 30.02 | | 20 day EMA | 29.96 | 29.93 | 29.9 | | 35 day EMA | 29.77 | 29.74 | 29.71 | | 50 day EMA | 29.54 | 29.51 | 29.48 |
SMA (simple moving average) of Pacer Trendpilottm PTEU
| SMA period | SMA current | SMA prev | SMA prev2 | | 5 day SMA | 30.18 | 30.17 | 30.15 | | 12 day SMA | 30.05 | 30.07 | 30.09 | | 20 day SMA | 29.97 | 29.94 | 29.91 | | 35 day SMA | 29.65 | 29.61 | 29.57 | | 50 day SMA | 29.54 | 29.51 | 29.48 | | 100 day SMA | 29.04 | 29.02 | 29 | | 150 day SMA | 28.35 | 28.34 | 28.33 | | 200 day SMA | 27.8 | 27.77 | 27.74 |
|
|
