ActiveU PSR full analysis,charts,indicators,moving averages,SMA,DMA,EMA,ADX,MACD,RSIActive U PSR WideScreen charts, DMA,SMA,EMA technical analysis, forecast prediction, by indicators ADX,MACD,RSI,CCI AMEX stock exchange
Daily price and charts and targets ActiveU Strong Daily Stock price targets for ActiveU PSR are 91.37 and 91.37 | Daily Target 1 | 91.37 | | Daily Target 2 | 91.37 | | Daily Target 3 | 91.37 | | Daily Target 4 | 91.37 | | Daily Target 5 | 91.37 |
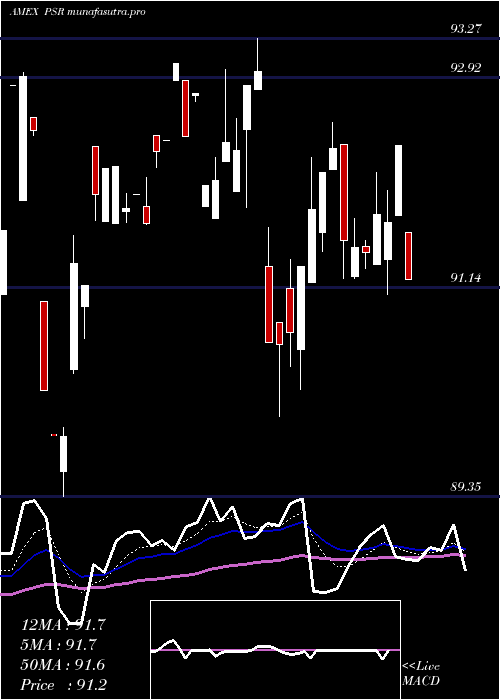
Daily price and volume Active U
| Date |
Closing |
Open |
Range |
Volume |
Fri 05 December 2025 |
91.37 (0.12%) |
91.37 |
91.37 - 91.37 |
0.1869 times |
Thu 04 December 2025 |
91.26 (-0.26%) |
91.72 |
91.26 - 91.72 |
0.2508 times |
Wed 03 December 2025 |
91.50 (-0.26%) |
91.14 |
91.14 - 91.50 |
2.5082 times |
Tue 02 December 2025 |
91.74 (-0.12%) |
91.74 |
91.74 - 91.74 |
0.2508 times |
Mon 01 December 2025 |
91.85 (-1.27%) |
92.04 |
91.85 - 92.16 |
1.7958 times |
Fri 28 November 2025 |
93.03 (0.01%) |
93.00 |
93.00 - 93.03 |
0.1254 times |
Wed 26 November 2025 |
93.02 (0.55%) |
92.63 |
92.63 - 93.02 |
0.691 times |
Tue 25 November 2025 |
92.51 (1.17%) |
92.34 |
92.34 - 92.60 |
0.7838 times |
Mon 24 November 2025 |
91.44 (0.11%) |
91.03 |
91.03 - 91.62 |
0.6396 times |
Fri 21 November 2025 |
91.34 (1.26%) |
90.70 |
90.69 - 91.61 |
2.7677 times |
Thu 20 November 2025 |
90.20 (-0.44%) |
91.04 |
90.20 - 91.04 |
1.6303 times |
Weekly price and charts ActiveU Strong weekly Stock price targets for ActiveU PSR are 90.75 and 91.77 | Weekly Target 1 | 90.54 | | Weekly Target 2 | 90.95 | | Weekly Target 3 | 91.556666666667 | | Weekly Target 4 | 91.97 | | Weekly Target 5 | 92.58 |
Weekly price and volumes for Active U
| Date |
Closing |
Open |
Range |
Volume |
Fri 05 December 2025 |
91.37 (-1.78%) |
92.04 |
91.14 - 92.16 |
0.7066 times |
Fri 28 November 2025 |
93.03 (1.85%) |
91.03 |
91.03 - 93.03 |
0.317 times |
Fri 21 November 2025 |
91.34 (-0.17%) |
91.28 |
90.20 - 91.61 |
1.6113 times |
Fri 14 November 2025 |
91.50 (-0.92%) |
92.20 |
91.09 - 93.28 |
2.2711 times |
Fri 07 November 2025 |
92.35 (1.47%) |
90.85 |
90.85 - 92.36 |
0.7796 times |
Fri 31 October 2025 |
91.01 (0%) |
90.16 |
90.16 - 91.12 |
0.1953 times |
Fri 31 October 2025 |
91.01 (-2.34%) |
94.02 |
90.16 - 94.10 |
1.7961 times |
Fri 24 October 2025 |
93.19 (0.02%) |
93.69 |
93.00 - 93.98 |
0.8655 times |
Fri 17 October 2025 |
93.17 (1.6%) |
90.28 |
90.28 - 93.17 |
0.9408 times |
Tue 07 October 2025 |
91.70 (-1.07%) |
92.78 |
91.57 - 92.78 |
0.5167 times |
Fri 03 October 2025 |
92.69 (0.56%) |
92.26 |
92.07 - 93.15 |
0.7288 times |
Monthly price and charts ActiveU Strong monthly Stock price targets for ActiveU PSR are 90.75 and 91.77 | Monthly Target 1 | 90.54 | | Monthly Target 2 | 90.95 | | Monthly Target 3 | 91.556666666667 | | Monthly Target 4 | 91.97 | | Monthly Target 5 | 92.58 |
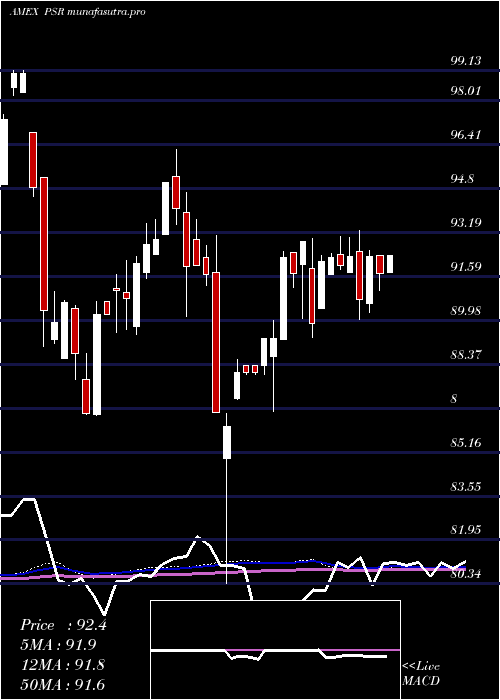
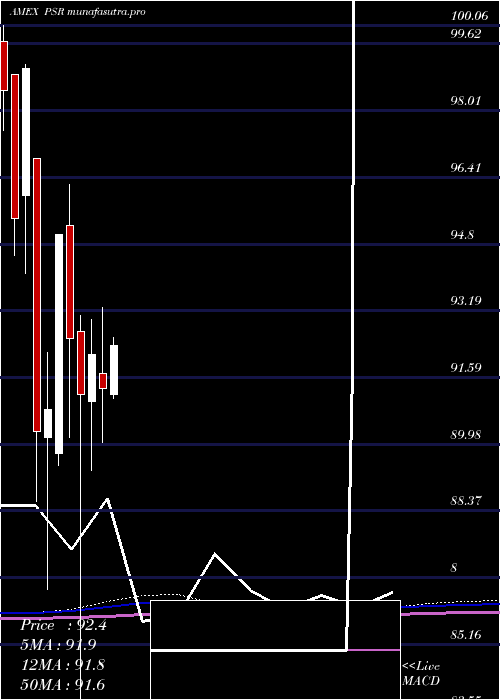
Monthly price and volumes Active U
| Date |
Closing |
Open |
Range |
Volume |
Fri 05 December 2025 |
91.37 (-1.78%) |
92.04 |
91.14 - 92.16 |
0.0959 times |
Fri 28 November 2025 |
93.03 (2.22%) |
90.85 |
90.20 - 93.28 |
0.676 times |
Fri 31 October 2025 |
91.01 (-1.78%) |
92.61 |
90.16 - 94.10 |
0.6437 times |
Tue 30 September 2025 |
92.66 (-0.41%) |
92.19 |
91.22 - 93.93 |
1.205 times |
Fri 29 August 2025 |
93.04 (3.07%) |
90.56 |
89.15 - 93.47 |
1.6363 times |
Thu 31 July 2025 |
90.27 (-1.15%) |
91.18 |
90.27 - 94.19 |
1.501 times |
Mon 30 June 2025 |
91.32 (-0.9%) |
91.68 |
90.03 - 93.27 |
0.5111 times |
Fri 30 May 2025 |
92.15 (1.07%) |
91.01 |
89.35 - 92.97 |
0.7334 times |
Wed 30 April 2025 |
91.17 (-1.47%) |
92.69 |
80.34 - 93.07 |
1.5909 times |
Mon 31 March 2025 |
92.53 (-2.63%) |
95.25 |
90.14 - 96.24 |
1.4066 times |
Fri 28 February 2025 |
95.03 (4.66%) |
89.76 |
89.46 - 95.03 |
1.0821 times |
DMA SMA EMA moving averages of Active U PSR
DMA (daily moving average) of Active U PSR
| DMA period | DMA value | | 5 day DMA | 91.54 | | 12 day DMA | 91.66 | | 20 day DMA | 91.77 | | 35 day DMA | 91.94 | | 50 day DMA | 91.97 | | 100 day DMA | 92 | | 150 day DMA | 91.9 | | 200 day DMA | 91.68 | EMA (exponential moving average) of Active U PSR
| EMA period | EMA current | EMA prev | EMA prev2 | | 5 day EMA | 91.57 | 91.67 | 91.87 | | 12 day EMA | 91.69 | 91.75 | 91.84 | | 20 day EMA | 91.73 | 91.77 | 91.82 | | 35 day EMA | 91.86 | 91.89 | 91.93 | | 50 day EMA | 91.97 | 91.99 | 92.02 |
SMA (simple moving average) of Active U PSR
| SMA period | SMA current | SMA prev | SMA prev2 | | 5 day SMA | 91.54 | 91.88 | 92.23 | | 12 day SMA | 91.66 | 91.66 | 91.62 | | 20 day SMA | 91.77 | 91.74 | 91.74 | | 35 day SMA | 91.94 | 91.98 | 92.01 | | 50 day SMA | 91.97 | 91.98 | 92 | | 100 day SMA | 92 | 92 | 92.01 | | 150 day SMA | 91.9 | 91.89 | 91.88 | | 200 day SMA | 91.68 | 91.69 | 91.7 |
|
|
