GlobalListed PSP full analysis,charts,indicators,moving averages,SMA,DMA,EMA,ADX,MACD,RSIGlobal Listed PSP WideScreen charts, DMA,SMA,EMA technical analysis, forecast prediction, by indicators ADX,MACD,RSI,CCI AMEX stock exchange
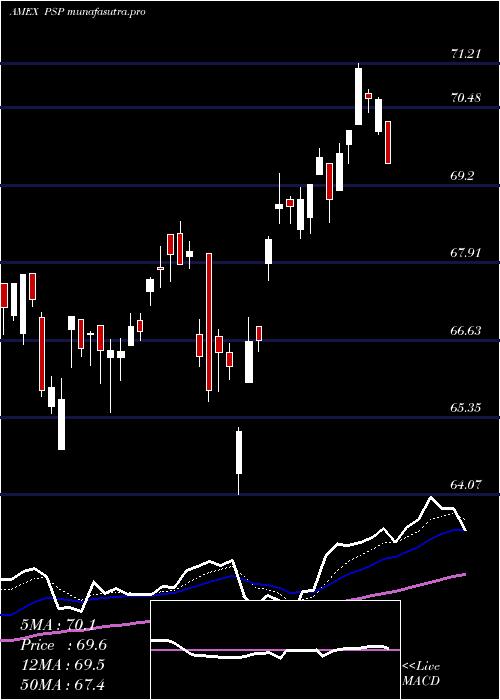
Daily price and charts and targets GlobalListed Strong Daily Stock price targets for GlobalListed PSP are 67.15 and 68.1 | Daily Target 1 | 66.94 | | Daily Target 2 | 67.35 | | Daily Target 3 | 67.886666666667 | | Daily Target 4 | 68.3 | | Daily Target 5 | 68.84 |
Daily price and volume Global Listed
| Date |
Closing |
Open |
Range |
Volume |
Thu 23 October 2025 |
67.77 (-0.41%) |
68.39 |
67.47 - 68.42 |
0.7813 times |
Wed 22 October 2025 |
68.05 (0.22%) |
68.04 |
67.73 - 68.25 |
0.5333 times |
Tue 21 October 2025 |
67.90 (0.37%) |
67.61 |
67.36 - 68.14 |
1.0993 times |
Mon 20 October 2025 |
67.65 (0.92%) |
67.00 |
67.00 - 67.73 |
0.35 times |
Fri 17 October 2025 |
67.03 (-0.21%) |
66.41 |
66.40 - 67.03 |
0.6272 times |
Thu 16 October 2025 |
67.17 (-2%) |
68.45 |
67.03 - 68.49 |
1.2879 times |
Wed 15 October 2025 |
68.54 (0.2%) |
68.72 |
68.06 - 68.93 |
0.7969 times |
Tue 14 October 2025 |
68.40 (0.94%) |
66.79 |
66.79 - 68.75 |
1.0135 times |
Mon 13 October 2025 |
67.76 (1.63%) |
67.12 |
66.90 - 67.77 |
1.6061 times |
Fri 10 October 2025 |
66.67 (-2.61%) |
68.43 |
66.55 - 68.43 |
1.9044 times |
Thu 09 October 2025 |
68.46 (-0.65%) |
68.77 |
68.15 - 68.77 |
4.6426 times |
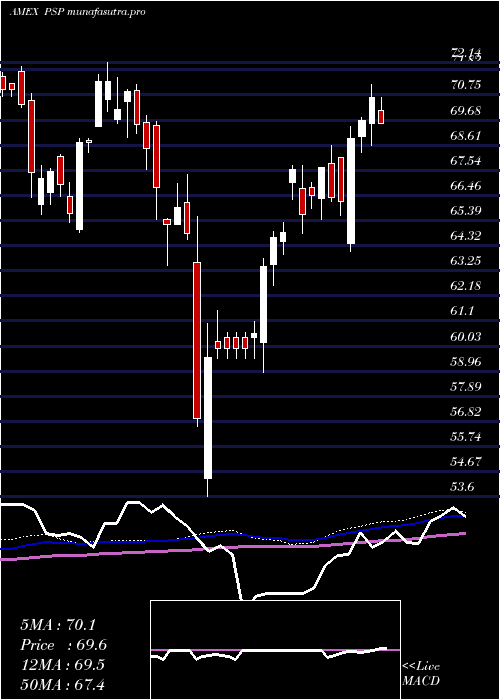
Weekly price and charts GlobalListed Strong weekly Stock price targets for GlobalListed PSP are 67.39 and 68.81 | Weekly Target 1 | 66.31 | | Weekly Target 2 | 67.04 | | Weekly Target 3 | 67.73 | | Weekly Target 4 | 68.46 | | Weekly Target 5 | 69.15 |
Weekly price and volumes for Global Listed
| Date |
Closing |
Open |
Range |
Volume |
Thu 23 October 2025 |
67.77 (1.1%) |
67.00 |
67.00 - 68.42 |
0.4071 times |
Fri 17 October 2025 |
67.03 (0.54%) |
67.12 |
66.40 - 68.93 |
0.7853 times |
Fri 10 October 2025 |
66.67 (-4.42%) |
70.07 |
66.55 - 70.07 |
1.8661 times |
Fri 03 October 2025 |
69.75 (0.48%) |
69.68 |
68.51 - 70.10 |
2.5814 times |
Fri 26 September 2025 |
69.42 (-3.77%) |
71.00 |
68.45 - 71.83 |
0.9728 times |
Fri 19 September 2025 |
72.14 (0.26%) |
71.86 |
71.15 - 72.90 |
0.6038 times |
Fri 12 September 2025 |
71.95 (1.85%) |
70.67 |
70.21 - 72.65 |
1.8998 times |
Fri 05 September 2025 |
70.64 (-1.31%) |
70.41 |
69.74 - 70.77 |
0.4611 times |
Fri 29 August 2025 |
71.58 (0%) |
71.77 |
71.14 - 71.85 |
0.0656 times |
Fri 29 August 2025 |
71.58 (-0.51%) |
71.95 |
70.82 - 71.95 |
0.357 times |
Fri 22 August 2025 |
71.95 (0.38%) |
71.38 |
70.02 - 72.31 |
0.4539 times |
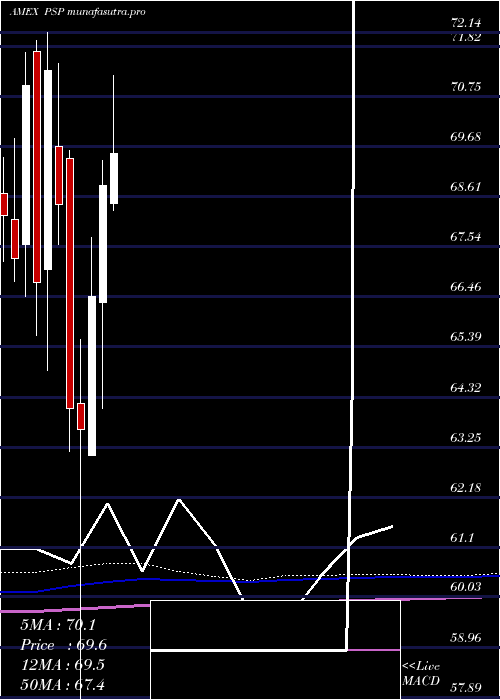
Monthly price and charts GlobalListed Strong monthly Stock price targets for GlobalListed PSP are 65.24 and 68.94 | Monthly Target 1 | 64.39 | | Monthly Target 2 | 66.08 | | Monthly Target 3 | 68.09 | | Monthly Target 4 | 69.78 | | Monthly Target 5 | 71.79 |
Monthly price and volumes Global Listed
| Date |
Closing |
Open |
Range |
Volume |
Thu 23 October 2025 |
67.77 (-1.81%) |
68.77 |
66.40 - 70.10 |
0.8857 times |
Tue 30 September 2025 |
69.02 (-3.58%) |
70.41 |
68.45 - 72.90 |
1.2209 times |
Fri 29 August 2025 |
71.58 (2.79%) |
68.32 |
67.85 - 72.31 |
0.4551 times |
Thu 31 July 2025 |
69.64 (1.15%) |
68.47 |
68.31 - 72.97 |
0.8728 times |
Mon 30 June 2025 |
68.85 (3.58%) |
66.35 |
64.07 - 69.39 |
1.2859 times |
Fri 30 May 2025 |
66.47 (4.46%) |
63.07 |
63.07 - 67.74 |
0.808 times |
Wed 30 April 2025 |
63.63 (-0.69%) |
64.19 |
53.60 - 65.56 |
1.3871 times |
Mon 31 March 2025 |
64.07 (-6.4%) |
69.44 |
63.16 - 69.60 |
1.4028 times |
Fri 28 February 2025 |
68.45 (-4.01%) |
69.69 |
67.58 - 71.47 |
0.8351 times |
Fri 31 January 2025 |
71.31 (6.8%) |
67.06 |
64.88 - 72.14 |
0.8466 times |
Tue 31 December 2024 |
66.77 (-5.96%) |
71.73 |
65.64 - 71.95 |
0.6899 times |
DMA SMA EMA moving averages of Global Listed PSP
DMA (daily moving average) of Global Listed PSP
| DMA period | DMA value | | 5 day DMA | 67.68 | | 12 day DMA | 67.86 | | 20 day DMA | 68.42 | | 35 day DMA | 69.61 | | 50 day DMA | 70.07 | | 100 day DMA | 69.71 | | 150 day DMA | 67.62 | | 200 day DMA | 67.84 | EMA (exponential moving average) of Global Listed PSP
| EMA period | EMA current | EMA prev | EMA prev2 | | 5 day EMA | 67.81 | 67.83 | 67.72 | | 12 day EMA | 68.04 | 68.09 | 68.1 | | 20 day EMA | 68.48 | 68.56 | 68.61 | | 35 day EMA | 69.18 | 69.26 | 69.33 | | 50 day EMA | 69.96 | 70.05 | 70.13 |
SMA (simple moving average) of Global Listed PSP
| SMA period | SMA current | SMA prev | SMA prev2 | | 5 day SMA | 67.68 | 67.56 | 67.66 | | 12 day SMA | 67.86 | 67.95 | 68.08 | | 20 day SMA | 68.42 | 68.48 | 68.53 | | 35 day SMA | 69.61 | 69.7 | 69.75 | | 50 day SMA | 70.07 | 70.15 | 70.23 | | 100 day SMA | 69.71 | 69.7 | 69.69 | | 150 day SMA | 67.62 | 67.61 | 67.6 | | 200 day SMA | 67.84 | 67.84 | 67.83 |
|
|
