DynamicSemiconductors PSI full analysis,charts,indicators,moving averages,SMA,DMA,EMA,ADX,MACD,RSIDynamic Semiconductors PSI WideScreen charts, DMA,SMA,EMA technical analysis, forecast prediction, by indicators ADX,MACD,RSI,CCI AMEX stock exchange
Daily price and charts and targets DynamicSemiconductors Strong Daily Stock price targets for DynamicSemiconductors PSI are 73.38 and 76.23 | Daily Target 1 | 71.03 | | Daily Target 2 | 72.88 | | Daily Target 3 | 73.876666666667 | | Daily Target 4 | 75.73 | | Daily Target 5 | 76.73 |
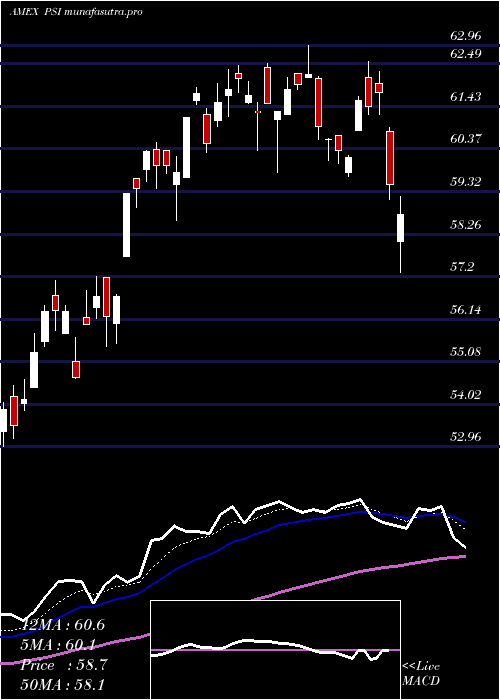
Daily price and volume Dynamic Semiconductors
| Date |
Closing |
Open |
Range |
Volume |
Thu 23 October 2025 |
74.74 (3.06%) |
72.75 |
72.02 - 74.87 |
0.2202 times |
Wed 22 October 2025 |
72.52 (-2.81%) |
74.01 |
71.22 - 74.22 |
0.3831 times |
Tue 21 October 2025 |
74.62 (-0.61%) |
74.78 |
74.07 - 74.95 |
0.5577 times |
Mon 20 October 2025 |
75.08 (2.54%) |
74.08 |
74.08 - 75.43 |
0.3218 times |
Fri 17 October 2025 |
73.22 (-0.79%) |
72.30 |
72.21 - 73.70 |
0.6175 times |
Thu 16 October 2025 |
73.80 (0.41%) |
74.58 |
73.05 - 74.58 |
0.2564 times |
Wed 15 October 2025 |
73.50 (3.11%) |
73.02 |
72.23 - 73.50 |
1.3747 times |
Tue 14 October 2025 |
71.28 (-1.29%) |
70.59 |
70.48 - 72.54 |
0.659 times |
Mon 13 October 2025 |
72.21 (5.48%) |
71.12 |
71.01 - 72.40 |
5.1772 times |
Fri 10 October 2025 |
68.46 (-7.02%) |
73.71 |
68.46 - 73.91 |
0.4324 times |
Thu 09 October 2025 |
73.63 (-0.5%) |
73.89 |
72.90 - 74.10 |
0.3399 times |
Weekly price and charts DynamicSemiconductors Strong weekly Stock price targets for DynamicSemiconductors PSI are 72.98 and 77.19 | Weekly Target 1 | 69.59 | | Weekly Target 2 | 72.16 | | Weekly Target 3 | 73.796666666667 | | Weekly Target 4 | 76.37 | | Weekly Target 5 | 78.01 |
Weekly price and volumes for Dynamic Semiconductors
| Date |
Closing |
Open |
Range |
Volume |
Thu 23 October 2025 |
74.74 (2.08%) |
74.08 |
71.22 - 75.43 |
0.7516 times |
Fri 17 October 2025 |
73.22 (6.95%) |
71.12 |
70.48 - 74.58 |
4.0982 times |
Fri 10 October 2025 |
68.46 (-5.15%) |
74.47 |
68.46 - 75.09 |
0.777 times |
Fri 03 October 2025 |
72.18 (4.28%) |
70.05 |
69.18 - 73.52 |
0.4947 times |
Fri 26 September 2025 |
69.22 (-1.7%) |
70.48 |
67.98 - 71.94 |
0.588 times |
Fri 19 September 2025 |
70.42 (4.84%) |
67.11 |
67.11 - 71.35 |
1.0738 times |
Fri 12 September 2025 |
67.17 (5.17%) |
64.49 |
64.39 - 67.36 |
0.88 times |
Fri 05 September 2025 |
63.87 (1.62%) |
61.13 |
60.78 - 64.16 |
0.457 times |
Fri 29 August 2025 |
62.85 (0%) |
64.06 |
62.54 - 64.20 |
0.2661 times |
Fri 29 August 2025 |
62.85 (0.37%) |
62.68 |
62.47 - 64.85 |
0.6135 times |
Fri 22 August 2025 |
62.62 (2.76%) |
60.88 |
58.62 - 63.26 |
0.5949 times |

Monthly price and charts DynamicSemiconductors Strong monthly Stock price targets for DynamicSemiconductors PSI are 71.6 and 78.57 | Monthly Target 1 | 65.91 | | Monthly Target 2 | 70.32 | | Monthly Target 3 | 72.876666666667 | | Monthly Target 4 | 77.29 | | Monthly Target 5 | 79.85 |
Monthly price and volumes Dynamic Semiconductors
| Date |
Closing |
Open |
Range |
Volume |
Thu 23 October 2025 |
74.74 (6.29%) |
69.60 |
68.46 - 75.43 |
1.2294 times |
Tue 30 September 2025 |
70.32 (11.89%) |
61.13 |
60.78 - 71.94 |
0.6631 times |
Fri 29 August 2025 |
62.85 (5.63%) |
58.06 |
57.31 - 64.85 |
0.6845 times |
Thu 31 July 2025 |
59.50 (-0.77%) |
59.49 |
58.60 - 62.96 |
0.6823 times |
Mon 30 June 2025 |
59.96 (17.75%) |
50.82 |
50.78 - 60.54 |
0.6111 times |
Fri 30 May 2025 |
50.92 (10.1%) |
46.81 |
46.31 - 54.61 |
1.3598 times |
Wed 30 April 2025 |
46.25 (-2.38%) |
47.18 |
37.64 - 48.91 |
1.6992 times |
Mon 31 March 2025 |
47.38 (-12.97%) |
55.05 |
45.93 - 55.05 |
0.9404 times |
Fri 28 February 2025 |
54.44 (-8.96%) |
57.82 |
52.83 - 61.89 |
0.8178 times |
Fri 31 January 2025 |
59.80 (3.25%) |
58.63 |
55.72 - 66.01 |
1.3124 times |
Tue 31 December 2024 |
57.92 (2.17%) |
58.61 |
56.69 - 61.66 |
0.5818 times |

DMA SMA EMA moving averages of Dynamic Semiconductors PSI
DMA (daily moving average) of Dynamic Semiconductors PSI
| DMA period | DMA value | | 5 day DMA | 74.04 | | 12 day DMA | 73.09 | | 20 day DMA | 72.41 | | 35 day DMA | 70.58 | | 50 day DMA | 68.06 | | 100 day DMA | 63.66 | | 150 day DMA | 58.3 | | 200 day DMA | 58.16 | EMA (exponential moving average) of Dynamic Semiconductors PSI
| EMA period | EMA current | EMA prev | EMA prev2 | | 5 day EMA | 73.9 | 73.48 | 73.96 | | 12 day EMA | 73.19 | 72.91 | 72.98 | | 20 day EMA | 72.27 | 72.01 | 71.96 | | 35 day EMA | 70.21 | 69.94 | 69.79 | | 50 day EMA | 68.14 | 67.87 | 67.68 |
SMA (simple moving average) of Dynamic Semiconductors PSI
| SMA period | SMA current | SMA prev | SMA prev2 | | 5 day SMA | 74.04 | 73.85 | 74.04 | | 12 day SMA | 73.09 | 72.84 | 72.94 | | 20 day SMA | 72.41 | 72.13 | 71.99 | | 35 day SMA | 70.58 | 70.25 | 69.93 | | 50 day SMA | 68.06 | 67.82 | 67.63 | | 100 day SMA | 63.66 | 63.42 | 63.22 | | 150 day SMA | 58.3 | 58.15 | 58.01 | | 200 day SMA | 58.16 | 58.09 | 58.04 |
|
|
