ParkNational PRK full analysis,charts,indicators,moving averages,SMA,DMA,EMA,ADX,MACD,RSIPark National PRK WideScreen charts, DMA,SMA,EMA technical analysis, forecast prediction, by indicators ADX,MACD,RSI,CCI AMEX stock exchange
Daily price and charts and targets ParkNational Strong Daily Stock price targets for ParkNational PRK are 155.55 and 158.12 | Daily Target 1 | 155.04 | | Daily Target 2 | 156.05 | | Daily Target 3 | 157.61 | | Daily Target 4 | 158.62 | | Daily Target 5 | 160.18 |
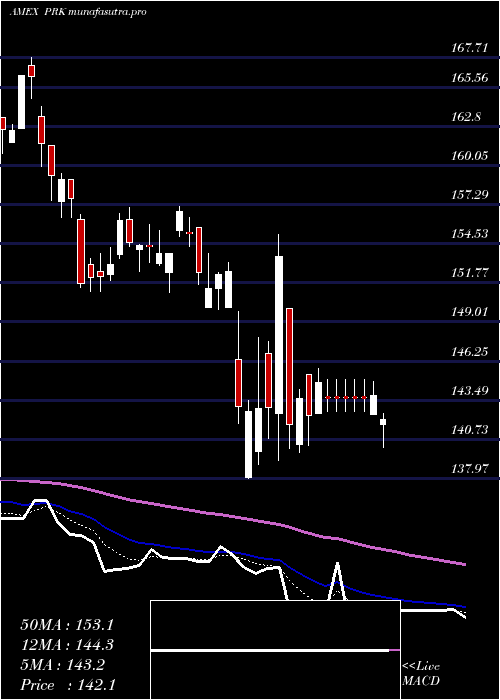
Daily price and volume Park National
| Date |
Closing |
Open |
Range |
Volume |
Thu 23 October 2025 |
157.06 (-0.98%) |
158.58 |
156.60 - 159.17 |
0.3243 times |
Wed 22 October 2025 |
158.62 (-0.69%) |
159.39 |
157.59 - 160.44 |
0.2905 times |
Tue 21 October 2025 |
159.73 (0.6%) |
158.15 |
157.31 - 159.73 |
0.6144 times |
Mon 20 October 2025 |
158.77 (2.38%) |
155.84 |
155.79 - 159.51 |
0.1789 times |
Fri 17 October 2025 |
155.08 (2.61%) |
152.09 |
149.85 - 156.02 |
1.5579 times |
Thu 16 October 2025 |
151.13 (-5.21%) |
159.15 |
150.29 - 159.15 |
2.2769 times |
Wed 15 October 2025 |
159.43 (-1.59%) |
162.48 |
159.14 - 162.49 |
1.088 times |
Tue 14 October 2025 |
162.00 (3.32%) |
155.05 |
155.05 - 162.01 |
1.322 times |
Mon 13 October 2025 |
156.79 (-1.96%) |
156.96 |
154.41 - 156.96 |
1.4761 times |
Tue 07 October 2025 |
159.92 (-1.48%) |
162.17 |
159.92 - 163.19 |
0.8712 times |
Mon 06 October 2025 |
162.32 (0.52%) |
163.88 |
160.33 - 165.15 |
0.4746 times |
Weekly price and charts ParkNational Strong weekly Stock price targets for ParkNational PRK are 156.43 and 161.08 | Weekly Target 1 | 153.11 | | Weekly Target 2 | 155.09 | | Weekly Target 3 | 157.76333333333 | | Weekly Target 4 | 159.74 | | Weekly Target 5 | 162.41 |
Weekly price and volumes for Park National
| Date |
Closing |
Open |
Range |
Volume |
Thu 23 October 2025 |
157.06 (1.28%) |
155.84 |
155.79 - 160.44 |
0.3737 times |
Fri 17 October 2025 |
155.08 (-3.03%) |
156.96 |
149.85 - 162.49 |
2.0491 times |
Tue 07 October 2025 |
159.92 (-0.97%) |
163.88 |
159.92 - 165.15 |
0.3572 times |
Fri 03 October 2025 |
161.48 (-2.55%) |
166.42 |
159.85 - 167.45 |
0.9393 times |
Fri 26 September 2025 |
165.71 (-2.21%) |
167.57 |
164.06 - 169.13 |
0.9233 times |
Fri 19 September 2025 |
169.45 (0.27%) |
170.05 |
162.98 - 171.57 |
2.0885 times |
Fri 12 September 2025 |
169.00 (-1.8%) |
171.81 |
166.30 - 172.77 |
1.0597 times |
Fri 05 September 2025 |
172.09 (0.19%) |
169.36 |
169.00 - 175.14 |
0.726 times |
Fri 29 August 2025 |
171.77 (0%) |
174.09 |
171.62 - 174.25 |
0.2055 times |
Fri 29 August 2025 |
171.77 (-0.99%) |
173.55 |
171.35 - 175.54 |
1.2777 times |
Fri 22 August 2025 |
173.49 (4.52%) |
165.82 |
163.24 - 174.01 |
0.9521 times |

Monthly price and charts ParkNational Strong monthly Stock price targets for ParkNational PRK are 145.81 and 161.11 | Monthly Target 1 | 142.05 | | Monthly Target 2 | 149.56 | | Monthly Target 3 | 157.35333333333 | | Monthly Target 4 | 164.86 | | Monthly Target 5 | 172.65 |
Monthly price and volumes Park National
| Date |
Closing |
Open |
Range |
Volume |
Thu 23 October 2025 |
157.06 (-3.37%) |
161.45 |
149.85 - 165.15 |
0.5569 times |
Tue 30 September 2025 |
162.53 (-5.38%) |
169.36 |
160.72 - 175.14 |
0.9139 times |
Fri 29 August 2025 |
171.77 (6.12%) |
160.76 |
156.50 - 175.54 |
0.9458 times |
Thu 31 July 2025 |
161.87 (-3.22%) |
168.14 |
160.82 - 179.48 |
1.5601 times |
Mon 30 June 2025 |
167.26 (2.89%) |
162.91 |
156.68 - 169.33 |
1.0085 times |
Fri 30 May 2025 |
162.56 (8.3%) |
150.61 |
149.05 - 172.37 |
1.0353 times |
Wed 30 April 2025 |
150.10 (-0.86%) |
151.37 |
137.97 - 155.19 |
0.9637 times |
Mon 31 March 2025 |
151.40 (-9.04%) |
167.10 |
150.01 - 167.71 |
1.0431 times |
Fri 28 February 2025 |
166.44 (-1.93%) |
165.11 |
160.92 - 174.01 |
0.6566 times |
Fri 31 January 2025 |
169.71 (-1%) |
174.63 |
161.99 - 175.92 |
1.3161 times |
Tue 31 December 2024 |
171.43 (-12.23%) |
190.61 |
167.36 - 192.34 |
0.8572 times |

DMA SMA EMA moving averages of Park National PRK
DMA (daily moving average) of Park National PRK
| DMA period | DMA value | | 5 day DMA | 157.85 | | 12 day DMA | 158.53 | | 20 day DMA | 160.7 | | 35 day DMA | 164.43 | | 50 day DMA | 166.13 | | 100 day DMA | 166.13 | | 150 day DMA | 162.01 | | 200 day DMA | 163 | EMA (exponential moving average) of Park National PRK
| EMA period | EMA current | EMA prev | EMA prev2 | | 5 day EMA | 157.86 | 158.26 | 158.08 | | 12 day EMA | 158.9 | 159.24 | 159.35 | | 20 day EMA | 160.46 | 160.82 | 161.05 | | 35 day EMA | 162.55 | 162.87 | 163.12 | | 50 day EMA | 164.89 | 165.21 | 165.48 |
SMA (simple moving average) of Park National PRK
| SMA period | SMA current | SMA prev | SMA prev2 | | 5 day SMA | 157.85 | 156.67 | 156.83 | | 12 day SMA | 158.53 | 158.88 | 159.11 | | 20 day SMA | 160.7 | 161.15 | 161.7 | | 35 day SMA | 164.43 | 164.85 | 165.22 | | 50 day SMA | 166.13 | 166.23 | 166.27 | | 100 day SMA | 166.13 | 166.2 | 166.24 | | 150 day SMA | 162.01 | 161.99 | 161.98 | | 200 day SMA | 163 | 163.08 | 163.14 |
|
|
