DynamicBuilding PKB full analysis,charts,indicators,moving averages,SMA,DMA,EMA,ADX,MACD,RSIDynamic Building PKB WideScreen charts, DMA,SMA,EMA technical analysis, forecast prediction, by indicators ADX,MACD,RSI,CCI AMEX stock exchange
Daily price and charts and targets DynamicBuilding Strong Daily Stock price targets for DynamicBuilding PKB are 95.28 and 97.56 | Daily Target 1 | 93.39 | | Daily Target 2 | 94.89 | | Daily Target 3 | 95.673333333333 | | Daily Target 4 | 97.17 | | Daily Target 5 | 97.95 |
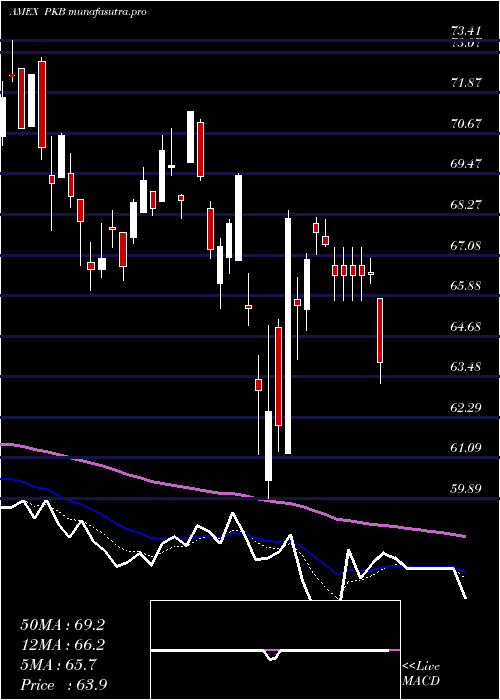
Daily price and volume Dynamic Building
| Date |
Closing |
Open |
Range |
Volume |
Thu 23 October 2025 |
96.38 (2.37%) |
94.18 |
94.18 - 96.46 |
0.5427 times |
Wed 22 October 2025 |
94.15 (-2.91%) |
96.88 |
93.52 - 97.42 |
1.3064 times |
Tue 21 October 2025 |
96.97 (0.49%) |
96.32 |
95.28 - 96.97 |
0.8809 times |
Mon 20 October 2025 |
96.50 (1.44%) |
96.27 |
95.97 - 96.85 |
0.5548 times |
Fri 17 October 2025 |
95.13 (-0.46%) |
95.06 |
94.57 - 95.38 |
0.5999 times |
Thu 16 October 2025 |
95.57 (-0.89%) |
96.62 |
95.37 - 96.62 |
0.578 times |
Wed 15 October 2025 |
96.43 (0.55%) |
96.75 |
96.16 - 96.84 |
1.3157 times |
Tue 14 October 2025 |
95.90 (1.77%) |
93.18 |
93.17 - 96.25 |
1.1441 times |
Mon 13 October 2025 |
94.23 (2.16%) |
93.81 |
93.81 - 94.57 |
1.2585 times |
Fri 10 October 2025 |
92.24 (-2.02%) |
94.62 |
92.24 - 95.15 |
1.8191 times |
Thu 09 October 2025 |
94.14 (-1.61%) |
96.05 |
94.08 - 96.05 |
3.1118 times |
Weekly price and charts DynamicBuilding Strong weekly Stock price targets for DynamicBuilding PKB are 94.95 and 98.85 | Weekly Target 1 | 91.87 | | Weekly Target 2 | 94.13 | | Weekly Target 3 | 95.773333333333 | | Weekly Target 4 | 98.03 | | Weekly Target 5 | 99.67 |
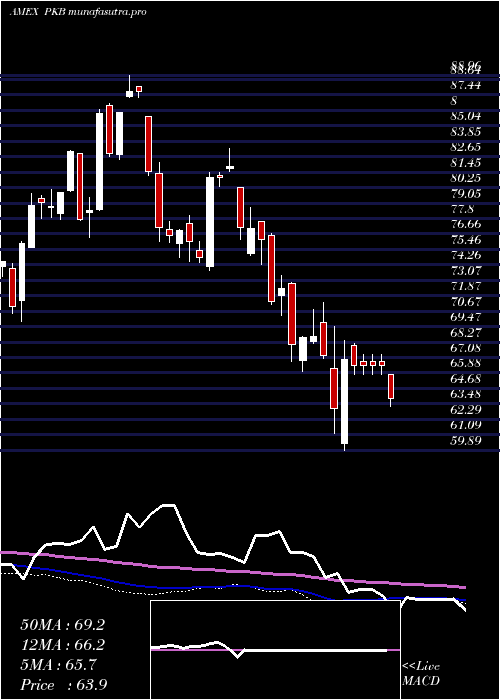
Weekly price and volumes for Dynamic Building
| Date |
Closing |
Open |
Range |
Volume |
Thu 23 October 2025 |
96.38 (1.31%) |
96.27 |
93.52 - 97.42 |
0.3085 times |
Fri 17 October 2025 |
95.13 (3.13%) |
93.81 |
93.17 - 96.84 |
0.4599 times |
Fri 10 October 2025 |
92.24 (-2.93%) |
95.51 |
92.24 - 96.05 |
0.9829 times |
Fri 03 October 2025 |
95.02 (1%) |
94.71 |
93.95 - 95.76 |
0.9587 times |
Fri 26 September 2025 |
94.08 (-0.52%) |
94.08 |
91.68 - 95.94 |
0.7737 times |
Fri 19 September 2025 |
94.57 (1.68%) |
93.46 |
92.38 - 95.29 |
1.3507 times |
Fri 12 September 2025 |
93.01 (0.79%) |
92.16 |
90.45 - 94.14 |
2.9433 times |
Fri 05 September 2025 |
92.28 (0.81%) |
90.15 |
89.75 - 93.09 |
1.1896 times |
Fri 29 August 2025 |
91.54 (0%) |
92.69 |
91.15 - 92.69 |
0.1709 times |
Fri 29 August 2025 |
91.54 (-0.39%) |
91.66 |
91.15 - 92.69 |
0.8618 times |
Fri 22 August 2025 |
91.90 (2.02%) |
90.00 |
88.58 - 92.50 |
1.6635 times |
Monthly price and charts DynamicBuilding Strong monthly Stock price targets for DynamicBuilding PKB are 94.31 and 99.49 | Monthly Target 1 | 90.17 | | Monthly Target 2 | 93.27 | | Monthly Target 3 | 95.346666666667 | | Monthly Target 4 | 98.45 | | Monthly Target 5 | 100.53 |
Monthly price and volumes Dynamic Building
| Date |
Closing |
Open |
Range |
Volume |
Thu 23 October 2025 |
96.38 (0.82%) |
95.30 |
92.24 - 97.42 |
0.3216 times |
Tue 30 September 2025 |
95.60 (4.44%) |
90.15 |
89.75 - 95.94 |
0.8432 times |
Fri 29 August 2025 |
91.54 (7.3%) |
84.36 |
82.88 - 92.69 |
0.8104 times |
Thu 31 July 2025 |
85.31 (6.17%) |
79.99 |
79.75 - 87.29 |
0.6487 times |
Mon 30 June 2025 |
80.35 (4.23%) |
76.80 |
75.53 - 81.00 |
0.2724 times |
Fri 30 May 2025 |
77.09 (9.96%) |
70.50 |
70.50 - 79.42 |
0.4055 times |
Wed 30 April 2025 |
70.11 (4.13%) |
67.00 |
59.89 - 70.18 |
0.7126 times |
Mon 31 March 2025 |
67.33 (-7%) |
72.80 |
65.50 - 72.90 |
3.581 times |
Fri 28 February 2025 |
72.40 (-6.14%) |
75.14 |
70.31 - 78.67 |
1.0045 times |
Fri 31 January 2025 |
77.14 (1.89%) |
76.44 |
73.82 - 83.31 |
1.4002 times |
Tue 31 December 2024 |
75.71 (-13.71%) |
85.74 |
75.00 - 85.74 |
0.9072 times |

DMA SMA EMA moving averages of Dynamic Building PKB
DMA (daily moving average) of Dynamic Building PKB
| DMA period | DMA value | | 5 day DMA | 95.83 | | 12 day DMA | 95.28 | | 20 day DMA | 95.08 | | 35 day DMA | 94.3 | | 50 day DMA | 93.35 | | 100 day DMA | 87.97 | | 150 day DMA | 82.35 | | 200 day DMA | 80.41 | EMA (exponential moving average) of Dynamic Building PKB
| EMA period | EMA current | EMA prev | EMA prev2 | | 5 day EMA | 95.77 | 95.46 | 96.11 | | 12 day EMA | 95.41 | 95.23 | 95.43 | | 20 day EMA | 95 | 94.86 | 94.94 | | 35 day EMA | 94.18 | 94.05 | 94.04 | | 50 day EMA | 93.36 | 93.24 | 93.2 |
SMA (simple moving average) of Dynamic Building PKB
| SMA period | SMA current | SMA prev | SMA prev2 | | 5 day SMA | 95.83 | 95.66 | 96.12 | | 12 day SMA | 95.28 | 95.05 | 95.1 | | 20 day SMA | 95.08 | 94.88 | 94.83 | | 35 day SMA | 94.3 | 94.18 | 94.08 | | 50 day SMA | 93.35 | 93.24 | 93.21 | | 100 day SMA | 87.97 | 87.78 | 87.61 | | 150 day SMA | 82.35 | 82.17 | 82 | | 200 day SMA | 80.41 | 80.31 | 80.22 |
|
|
