MarketVectors PFXF full analysis,charts,indicators,moving averages,SMA,DMA,EMA,ADX,MACD,RSIMarket Vectors PFXF WideScreen charts, DMA,SMA,EMA technical analysis, forecast prediction, by indicators ADX,MACD,RSI,CCI AMEX stock exchange
Daily price and charts and targets MarketVectors Strong Daily Stock price targets for MarketVectors PFXF are 17.87 and 17.99 | Daily Target 1 | 17.78 | | Daily Target 2 | 17.84 | | Daily Target 3 | 17.896666666667 | | Daily Target 4 | 17.96 | | Daily Target 5 | 18.02 |
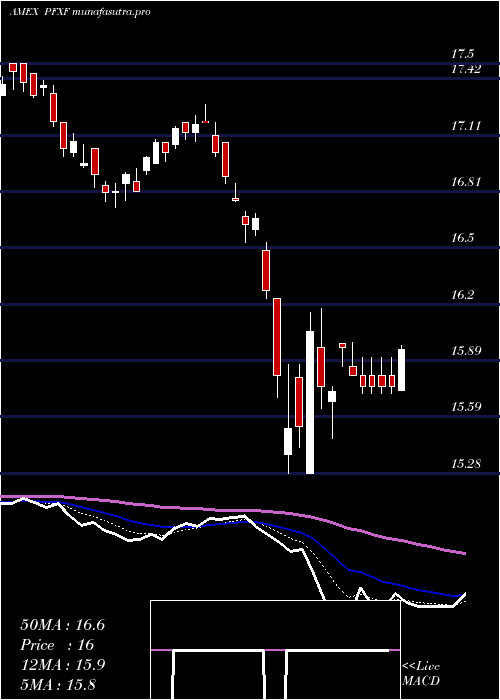
Daily price and volume Market Vectors
| Date |
Closing |
Open |
Range |
Volume |
Thu 23 October 2025 |
17.91 (0.39%) |
17.86 |
17.83 - 17.95 |
1.0074 times |
Wed 22 October 2025 |
17.84 (-0.61%) |
17.97 |
17.80 - 17.97 |
1.0374 times |
Tue 21 October 2025 |
17.95 (0.06%) |
17.97 |
17.90 - 17.98 |
0.9609 times |
Mon 20 October 2025 |
17.94 (0.9%) |
17.85 |
17.75 - 17.95 |
0.687 times |
Fri 17 October 2025 |
17.78 (0.06%) |
17.74 |
17.71 - 17.80 |
0.8475 times |
Thu 16 October 2025 |
17.77 (-0.73%) |
17.87 |
17.73 - 17.90 |
1.0028 times |
Wed 15 October 2025 |
17.90 (0.45%) |
17.87 |
17.83 - 17.95 |
0.8051 times |
Tue 14 October 2025 |
17.82 (0.22%) |
17.80 |
17.69 - 17.88 |
1.3945 times |
Mon 13 October 2025 |
17.78 (0.51%) |
17.82 |
17.73 - 17.85 |
1.2155 times |
Fri 10 October 2025 |
17.69 (-1.17%) |
17.95 |
17.64 - 17.95 |
1.0419 times |
Thu 09 October 2025 |
17.90 (-0.72%) |
18.03 |
17.89 - 18.04 |
0.7136 times |
Weekly price and charts MarketVectors Strong weekly Stock price targets for MarketVectors PFXF are 17.83 and 18.06 | Weekly Target 1 | 17.65 | | Weekly Target 2 | 17.78 | | Weekly Target 3 | 17.88 | | Weekly Target 4 | 18.01 | | Weekly Target 5 | 18.11 |
Weekly price and volumes for Market Vectors
| Date |
Closing |
Open |
Range |
Volume |
Thu 23 October 2025 |
17.91 (0.73%) |
17.85 |
17.75 - 17.98 |
0.9673 times |
Fri 17 October 2025 |
17.78 (0.51%) |
17.82 |
17.69 - 17.95 |
1.3792 times |
Fri 10 October 2025 |
17.69 (-1.61%) |
17.98 |
17.59 - 18.08 |
1.1866 times |
Fri 03 October 2025 |
17.98 (0.56%) |
17.91 |
17.62 - 18.03 |
0.8874 times |
Fri 26 September 2025 |
17.88 (-0.5%) |
18.00 |
17.76 - 18.00 |
1.0148 times |
Fri 19 September 2025 |
17.97 (0.45%) |
17.95 |
17.89 - 18.04 |
1.1494 times |
Fri 12 September 2025 |
17.89 (0.56%) |
17.85 |
17.73 - 17.97 |
1.1442 times |
Fri 05 September 2025 |
17.79 (0.62%) |
17.54 |
17.43 - 17.83 |
1.0794 times |
Fri 29 August 2025 |
17.68 (0%) |
17.85 |
17.68 - 17.85 |
0.1394 times |
Fri 29 August 2025 |
17.68 (-1.39%) |
17.94 |
17.68 - 17.94 |
1.0524 times |
Fri 22 August 2025 |
17.93 (1.07%) |
17.77 |
17.67 - 17.95 |
0.8702 times |

Monthly price and charts MarketVectors Strong monthly Stock price targets for MarketVectors PFXF are 17.75 and 18.24 | Monthly Target 1 | 17.37 | | Monthly Target 2 | 17.64 | | Monthly Target 3 | 17.86 | | Monthly Target 4 | 18.13 | | Monthly Target 5 | 18.35 |
Monthly price and volumes Market Vectors
| Date |
Closing |
Open |
Range |
Volume |
Thu 23 October 2025 |
17.91 (0.79%) |
17.68 |
17.59 - 18.08 |
0.8521 times |
Tue 30 September 2025 |
17.77 (0.51%) |
17.54 |
17.43 - 18.04 |
0.9788 times |
Fri 29 August 2025 |
17.68 (0.86%) |
17.48 |
17.31 - 17.95 |
0.8234 times |
Thu 31 July 2025 |
17.53 (2.39%) |
17.00 |
16.98 - 17.71 |
0.8476 times |
Mon 30 June 2025 |
17.12 (1.3%) |
16.76 |
16.73 - 17.20 |
0.6975 times |
Fri 30 May 2025 |
16.90 (1.75%) |
16.44 |
16.37 - 17.10 |
1.0065 times |
Wed 30 April 2025 |
16.61 (-0.89%) |
16.67 |
15.28 - 16.70 |
1.7064 times |
Mon 31 March 2025 |
16.76 (-3.57%) |
17.34 |
16.72 - 17.38 |
1.0344 times |
Fri 28 February 2025 |
17.38 (-0.23%) |
17.29 |
17.18 - 17.50 |
0.8748 times |
Fri 31 January 2025 |
17.42 (0.99%) |
17.30 |
16.91 - 17.75 |
1.1785 times |
Tue 31 December 2024 |
17.25 (-4.11%) |
17.85 |
17.08 - 17.97 |
0.9161 times |

DMA SMA EMA moving averages of Market Vectors PFXF
DMA (daily moving average) of Market Vectors PFXF
| DMA period | DMA value | | 5 day DMA | 17.88 | | 12 day DMA | 17.86 | | 20 day DMA | 17.88 | | 35 day DMA | 17.89 | | 50 day DMA | 17.84 | | 100 day DMA | 17.57 | | 150 day DMA | 17.2 | | 200 day DMA | 17.22 | EMA (exponential moving average) of Market Vectors PFXF
| EMA period | EMA current | EMA prev | EMA prev2 | | 5 day EMA | 17.88 | 17.87 | 17.88 | | 12 day EMA | 17.88 | 17.87 | 17.87 | | 20 day EMA | 17.87 | 17.87 | 17.87 | | 35 day EMA | 17.87 | 17.87 | 17.87 | | 50 day EMA | 17.83 | 17.83 | 17.83 |
SMA (simple moving average) of Market Vectors PFXF
| SMA period | SMA current | SMA prev | SMA prev2 | | 5 day SMA | 17.88 | 17.86 | 17.87 | | 12 day SMA | 17.86 | 17.87 | 17.88 | | 20 day SMA | 17.88 | 17.88 | 17.88 | | 35 day SMA | 17.89 | 17.88 | 17.87 | | 50 day SMA | 17.84 | 17.84 | 17.84 | | 100 day SMA | 17.57 | 17.56 | 17.55 | | 150 day SMA | 17.2 | 17.2 | 17.19 | | 200 day SMA | 17.22 | 17.22 | 17.22 |
|
|
