PacerUs PEXL full analysis,charts,indicators,moving averages,SMA,DMA,EMA,ADX,MACD,RSIPacer Us PEXL WideScreen charts, DMA,SMA,EMA technical analysis, forecast prediction, by indicators ADX,MACD,RSI,CCI AMEX stock exchange
Daily price and charts and targets PacerUs Strong Daily Stock price targets for PacerUs PEXL are 58.71 and 59.72 | Daily Target 1 | 57.86 | | Daily Target 2 | 58.54 | | Daily Target 3 | 58.873333333333 | | Daily Target 4 | 59.55 | | Daily Target 5 | 59.88 |
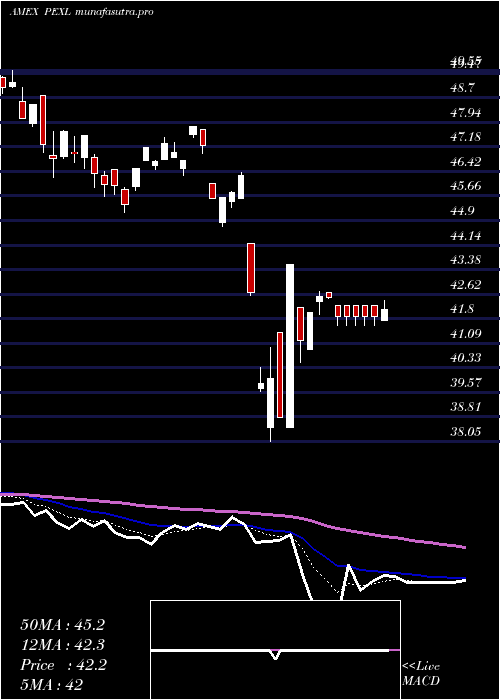
Daily price and volume Pacer Us
| Date |
Closing |
Open |
Range |
Volume |
Thu 23 October 2025 |
59.21 (1.95%) |
58.20 |
58.20 - 59.21 |
1.4485 times |
Wed 22 October 2025 |
58.08 (-1.09%) |
58.53 |
58.08 - 58.53 |
0.5177 times |
Tue 21 October 2025 |
58.72 (0.2%) |
58.46 |
58.46 - 58.73 |
0.3449 times |
Mon 20 October 2025 |
58.60 (1.44%) |
58.17 |
57.71 - 58.60 |
0.7859 times |
Fri 17 October 2025 |
57.77 (0.03%) |
57.40 |
57.40 - 57.85 |
0.2375 times |
Thu 16 October 2025 |
57.75 (0.24%) |
57.59 |
57.59 - 57.75 |
0.0698 times |
Wed 15 October 2025 |
57.61 (0.82%) |
57.73 |
57.61 - 57.90 |
0.6897 times |
Tue 14 October 2025 |
57.14 (0.26%) |
56.14 |
56.14 - 57.39 |
1.7244 times |
Mon 13 October 2025 |
56.99 (2.43%) |
56.79 |
56.64 - 57.00 |
1.595 times |
Fri 10 October 2025 |
55.64 (-3.97%) |
58.10 |
55.64 - 58.10 |
2.5865 times |
Thu 09 October 2025 |
57.94 (-1.02%) |
58.55 |
57.84 - 58.55 |
3.8367 times |
Weekly price and charts PacerUs Strong weekly Stock price targets for PacerUs PEXL are 58.46 and 59.96 | Weekly Target 1 | 57.21 | | Weekly Target 2 | 58.21 | | Weekly Target 3 | 58.71 | | Weekly Target 4 | 59.71 | | Weekly Target 5 | 60.21 |
Weekly price and volumes for Pacer Us
| Date |
Closing |
Open |
Range |
Volume |
Thu 23 October 2025 |
59.21 (2.49%) |
58.17 |
57.71 - 59.21 |
0.7877 times |
Fri 17 October 2025 |
57.77 (3.83%) |
56.79 |
56.14 - 57.90 |
1.098 times |
Fri 10 October 2025 |
55.64 (-4.37%) |
58.84 |
55.64 - 58.84 |
3.7119 times |
Fri 03 October 2025 |
58.18 (2%) |
56.91 |
56.90 - 58.39 |
0.4659 times |
Fri 26 September 2025 |
57.04 (-0.51%) |
57.23 |
56.33 - 57.96 |
0.9978 times |
Fri 19 September 2025 |
57.33 (1.99%) |
56.52 |
56.20 - 57.63 |
0.5592 times |
Fri 12 September 2025 |
56.21 (0.97%) |
55.68 |
55.55 - 56.74 |
1.0307 times |
Fri 05 September 2025 |
55.67 (0.71%) |
54.83 |
54.63 - 55.80 |
0.3509 times |
Fri 29 August 2025 |
55.28 (0%) |
55.27 |
55.17 - 55.37 |
0.2851 times |
Fri 29 August 2025 |
55.28 (-0.05%) |
55.27 |
55.17 - 55.85 |
0.7127 times |
Fri 22 August 2025 |
55.31 (1.95%) |
54.40 |
53.42 - 55.53 |
0.954 times |

Monthly price and charts PacerUs Strong monthly Stock price targets for PacerUs PEXL are 57.43 and 61 | Monthly Target 1 | 54.45 | | Monthly Target 2 | 56.83 | | Monthly Target 3 | 58.02 | | Monthly Target 4 | 60.4 | | Monthly Target 5 | 61.59 |
Monthly price and volumes Pacer Us
| Date |
Closing |
Open |
Range |
Volume |
Thu 23 October 2025 |
59.21 (3.24%) |
57.49 |
55.64 - 59.21 |
0.5172 times |
Tue 30 September 2025 |
57.35 (3.74%) |
54.83 |
54.63 - 57.96 |
0.2721 times |
Fri 29 August 2025 |
55.28 (2.96%) |
53.08 |
52.23 - 55.85 |
0.4029 times |
Thu 31 July 2025 |
53.69 (3.39%) |
51.78 |
51.78 - 54.94 |
0.5224 times |
Mon 30 June 2025 |
51.93 (7.69%) |
48.08 |
47.76 - 51.93 |
1.3672 times |
Fri 30 May 2025 |
48.22 (7.06%) |
45.29 |
45.26 - 49.45 |
0.9509 times |
Wed 30 April 2025 |
45.04 (-1.27%) |
45.50 |
38.05 - 46.38 |
0.8783 times |
Mon 31 March 2025 |
45.62 (-5.92%) |
48.76 |
44.70 - 48.76 |
1.3148 times |
Fri 28 February 2025 |
48.49 (-3.73%) |
49.21 |
47.82 - 51.05 |
1.8566 times |
Fri 31 January 2025 |
50.37 (4.68%) |
48.66 |
47.96 - 51.60 |
1.9175 times |
Tue 31 December 2024 |
48.12 (-5.14%) |
51.14 |
47.91 - 51.14 |
0.826 times |

DMA SMA EMA moving averages of Pacer Us PEXL
DMA (daily moving average) of Pacer Us PEXL
| DMA period | DMA value | | 5 day DMA | 58.48 | | 12 day DMA | 57.83 | | 20 day DMA | 57.82 | | 35 day DMA | 57.29 | | 50 day DMA | 56.57 | | 100 day DMA | 54.46 | | 150 day DMA | 51.4 | | 200 day DMA | 50.82 | EMA (exponential moving average) of Pacer Us PEXL
| EMA period | EMA current | EMA prev | EMA prev2 | | 5 day EMA | 58.5 | 58.15 | 58.18 | | 12 day EMA | 58.08 | 57.87 | 57.83 | | 20 day EMA | 57.77 | 57.62 | 57.57 | | 35 day EMA | 57.15 | 57.03 | 56.97 | | 50 day EMA | 56.57 | 56.46 | 56.39 |
SMA (simple moving average) of Pacer Us PEXL
| SMA period | SMA current | SMA prev | SMA prev2 | | 5 day SMA | 58.48 | 58.18 | 58.09 | | 12 day SMA | 57.83 | 57.72 | 57.77 | | 20 day SMA | 57.82 | 57.68 | 57.63 | | 35 day SMA | 57.29 | 57.18 | 57.09 | | 50 day SMA | 56.57 | 56.48 | 56.43 | | 100 day SMA | 54.46 | 54.35 | 54.25 | | 150 day SMA | 51.4 | 51.32 | 51.25 | | 200 day SMA | 50.82 | 50.77 | 50.72 |
|
|
