PedevcoCorp PED full analysis,charts,indicators,moving averages,SMA,DMA,EMA,ADX,MACD,RSIPedevco Corp PED WideScreen charts, DMA,SMA,EMA technical analysis, forecast prediction, by indicators ADX,MACD,RSI,CCI AMEX stock exchange
Daily price and charts and targets PedevcoCorp Strong Daily Stock price targets for PedevcoCorp PED are 0.55 and 0.67 | Daily Target 1 | 0.52 | | Daily Target 2 | 0.57 | | Daily Target 3 | 0.63666666666667 | | Daily Target 4 | 0.69 | | Daily Target 5 | 0.76 |
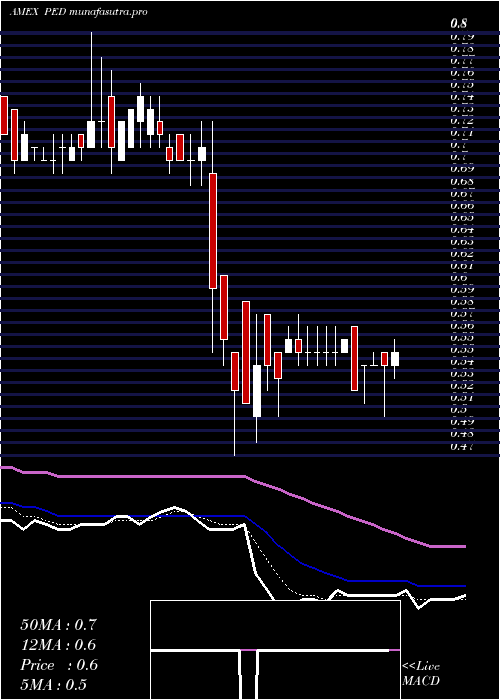
Daily price and volume Pedevco Corp
| Date |
Closing |
Open |
Range |
Volume |
Thu 23 October 2025 |
0.63 (10.53%) |
0.66 |
0.58 - 0.70 |
4.3928 times |
Wed 22 October 2025 |
0.57 (-1.72%) |
0.57 |
0.56 - 0.59 |
0.4694 times |
Tue 21 October 2025 |
0.58 (1.75%) |
0.56 |
0.56 - 0.59 |
0.3361 times |
Mon 20 October 2025 |
0.57 (0%) |
0.58 |
0.56 - 0.59 |
0.3944 times |
Fri 17 October 2025 |
0.57 (1.79%) |
0.56 |
0.56 - 0.58 |
0.2219 times |
Thu 16 October 2025 |
0.56 (-3.45%) |
0.59 |
0.56 - 0.59 |
0.4068 times |
Wed 15 October 2025 |
0.58 (-1.69%) |
0.58 |
0.57 - 0.59 |
0.3831 times |
Tue 14 October 2025 |
0.59 (1.72%) |
0.58 |
0.56 - 0.59 |
0.7702 times |
Mon 13 October 2025 |
0.58 (1.75%) |
0.59 |
0.56 - 0.59 |
1.4614 times |
Fri 10 October 2025 |
0.57 (-3.39%) |
0.59 |
0.56 - 0.59 |
1.1639 times |
Thu 09 October 2025 |
0.59 (0%) |
0.60 |
0.59 - 0.60 |
0.5921 times |
Weekly price and charts PedevcoCorp Strong weekly Stock price targets for PedevcoCorp PED are 0.6 and 0.74 | Weekly Target 1 | 0.49 | | Weekly Target 2 | 0.56 | | Weekly Target 3 | 0.63 | | Weekly Target 4 | 0.7 | | Weekly Target 5 | 0.77 |
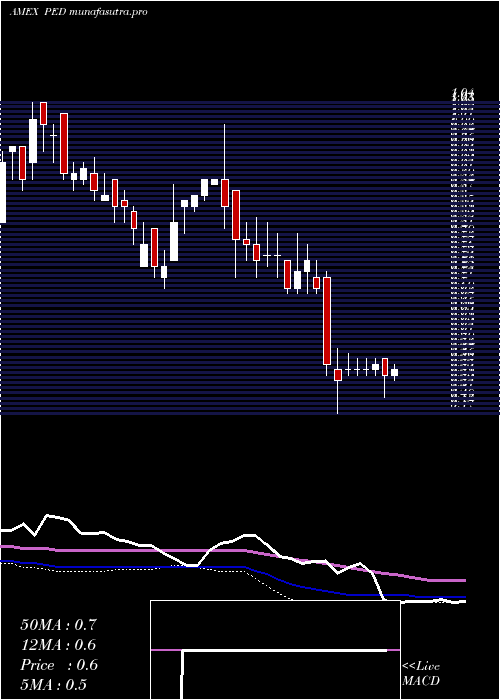
Weekly price and volumes for Pedevco Corp
| Date |
Closing |
Open |
Range |
Volume |
Thu 23 October 2025 |
0.63 (10.53%) |
0.58 |
0.56 - 0.70 |
1.5599 times |
Fri 17 October 2025 |
0.57 (0%) |
0.59 |
0.56 - 0.59 |
0.9046 times |
Fri 10 October 2025 |
0.57 (-1.72%) |
0.59 |
0.56 - 0.60 |
1.2078 times |
Fri 03 October 2025 |
0.58 (-3.33%) |
0.60 |
0.57 - 0.61 |
0.6752 times |
Fri 26 September 2025 |
0.60 (3.45%) |
0.60 |
0.57 - 0.60 |
0.8049 times |
Fri 19 September 2025 |
0.58 (-3.33%) |
0.59 |
0.58 - 0.62 |
0.8831 times |
Fri 12 September 2025 |
0.60 (-3.23%) |
0.62 |
0.59 - 0.63 |
1.2881 times |
Fri 05 September 2025 |
0.62 (1.64%) |
0.61 |
0.60 - 0.63 |
0.4065 times |
Fri 29 August 2025 |
0.61 (0%) |
0.60 |
0.60 - 0.66 |
0.7188 times |
Fri 29 August 2025 |
0.61 (5.17%) |
0.58 |
0.58 - 0.66 |
1.5512 times |
Fri 22 August 2025 |
0.58 (-3.33%) |
0.59 |
0.56 - 0.60 |
0.8988 times |
Monthly price and charts PedevcoCorp Strong monthly Stock price targets for PedevcoCorp PED are 0.6 and 0.74 | Monthly Target 1 | 0.49 | | Monthly Target 2 | 0.56 | | Monthly Target 3 | 0.63 | | Monthly Target 4 | 0.7 | | Monthly Target 5 | 0.77 |
Monthly price and volumes Pedevco Corp
| Date |
Closing |
Open |
Range |
Volume |
Thu 23 October 2025 |
0.63 (8.62%) |
0.57 |
0.56 - 0.70 |
0.8569 times |
Tue 30 September 2025 |
0.58 (-4.92%) |
0.61 |
0.57 - 0.63 |
0.765 times |
Fri 29 August 2025 |
0.61 (-6.15%) |
0.65 |
0.56 - 0.66 |
0.9472 times |
Thu 31 July 2025 |
0.65 (0%) |
0.64 |
0.58 - 0.69 |
0.8737 times |
Mon 30 June 2025 |
0.65 (1.56%) |
0.63 |
0.63 - 0.82 |
2.2944 times |
Fri 30 May 2025 |
0.64 (18.52%) |
0.55 |
0.51 - 0.69 |
0.6787 times |
Wed 30 April 2025 |
0.54 (-22.86%) |
0.70 |
0.47 - 0.73 |
1.1761 times |
Mon 31 March 2025 |
0.70 (-7.89%) |
0.75 |
0.69 - 0.80 |
0.3942 times |
Fri 28 February 2025 |
0.76 (-3.8%) |
0.79 |
0.72 - 0.83 |
0.5939 times |
Fri 31 January 2025 |
0.79 (1.28%) |
0.79 |
0.72 - 1.00 |
1.4199 times |
Tue 31 December 2024 |
0.78 (-8.24%) |
0.84 |
0.70 - 0.85 |
0.4526 times |

DMA SMA EMA moving averages of Pedevco Corp PED
DMA (daily moving average) of Pedevco Corp PED
| DMA period | DMA value | | 5 day DMA | 0.58 | | 12 day DMA | 0.58 | | 20 day DMA | 0.58 | | 35 day DMA | 0.59 | | 50 day DMA | 0.59 | | 100 day DMA | 0.62 | | 150 day DMA | 0.61 | | 200 day DMA | 0.66 | EMA (exponential moving average) of Pedevco Corp PED
| EMA period | EMA current | EMA prev | EMA prev2 | | 5 day EMA | 0.59 | 0.57 | 0.57 | | 12 day EMA | 0.6 | 0.59 | 0.59 | | 20 day EMA | 0.6 | 0.6 | 0.6 | | 35 day EMA | 0.6 | 0.6 | 0.6 | | 50 day EMA | 0.59 | 0.59 | 0.59 |
SMA (simple moving average) of Pedevco Corp PED
| SMA period | SMA current | SMA prev | SMA prev2 | | 5 day SMA | 0.58 | 0.57 | 0.57 | | 12 day SMA | 0.58 | 0.58 | 0.58 | | 20 day SMA | 0.58 | 0.58 | 0.58 | | 35 day SMA | 0.59 | 0.59 | 0.59 | | 50 day SMA | 0.59 | 0.59 | 0.59 | | 100 day SMA | 0.62 | 0.62 | 0.62 | | 150 day SMA | 0.61 | 0.61 | 0.61 | | 200 day SMA | 0.66 | 0.66 | 0.66 |
|
|
