PacificGas PCG-I full analysis,charts,indicators,moving averages,SMA,DMA,EMA,ADX,MACD,RSIPacific Gas PCG-I WideScreen charts, DMA,SMA,EMA technical analysis, forecast prediction, by indicators ADX,MACD,RSI,CCI AMEX stock exchange
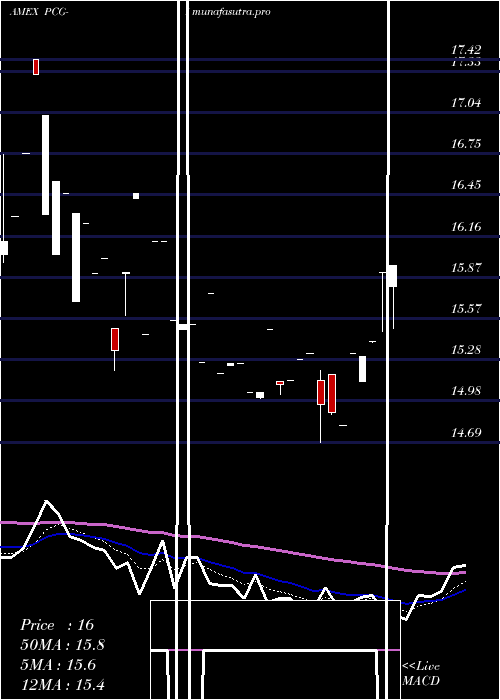
Daily price and charts and targets PacificGas Strong Daily Stock price targets for PacificGas PCG-I are 16.54 and 16.89 | Daily Target 1 | 16.24 | | Daily Target 2 | 16.48 | | Daily Target 3 | 16.593333333333 | | Daily Target 4 | 16.83 | | Daily Target 5 | 16.94 |
Daily price and volume Pacific Gas
| Date |
Closing |
Open |
Range |
Volume |
Thu 23 October 2025 |
16.71 (2.14%) |
16.36 |
16.36 - 16.71 |
0.3158 times |
Wed 22 October 2025 |
16.36 (0%) |
16.36 |
16.36 - 16.36 |
0.1053 times |
Tue 21 October 2025 |
16.36 (-1.33%) |
16.36 |
16.36 - 16.36 |
0.2105 times |
Mon 20 October 2025 |
16.58 (3.75%) |
16.58 |
16.58 - 16.58 |
0.1053 times |
Fri 17 October 2025 |
15.98 (-0.12%) |
16.01 |
15.98 - 16.01 |
0.4211 times |
Thu 16 October 2025 |
16.00 (0.63%) |
15.99 |
15.99 - 16.05 |
1.1579 times |
Wed 15 October 2025 |
15.90 (-0.62%) |
15.84 |
15.84 - 15.94 |
2.3158 times |
Tue 14 October 2025 |
16.00 (0.31%) |
15.55 |
15.55 - 16.00 |
1.4737 times |
Mon 13 October 2025 |
15.95 (0%) |
15.95 |
15.56 - 16.00 |
3.7895 times |
Fri 10 October 2025 |
15.95 (-0.31%) |
15.95 |
15.95 - 15.95 |
0.1053 times |
Mon 06 October 2025 |
16.00 (0%) |
15.97 |
15.60 - 16.00 |
1.0526 times |
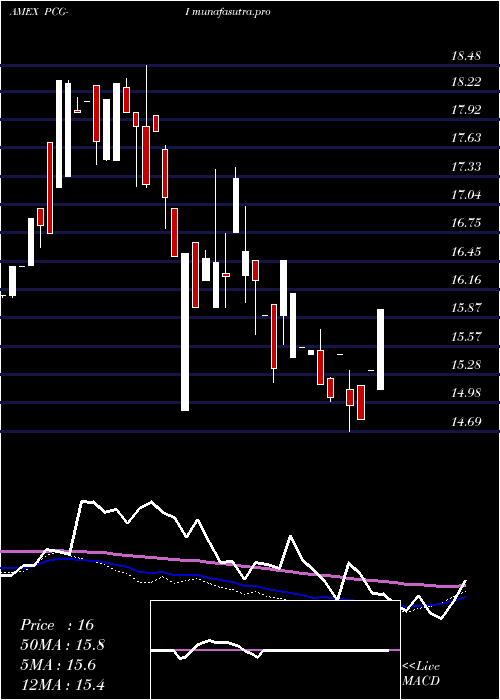
Weekly price and charts PacificGas Strong weekly Stock price targets for PacificGas PCG-I are 16.54 and 16.89 | Weekly Target 1 | 16.24 | | Weekly Target 2 | 16.48 | | Weekly Target 3 | 16.593333333333 | | Weekly Target 4 | 16.83 | | Weekly Target 5 | 16.94 |
Weekly price and volumes for Pacific Gas
| Date |
Closing |
Open |
Range |
Volume |
Thu 23 October 2025 |
16.71 (4.57%) |
16.58 |
16.36 - 16.71 |
0.3196 times |
Fri 17 October 2025 |
15.98 (0.19%) |
15.95 |
15.55 - 16.05 |
3.9726 times |
Fri 10 October 2025 |
15.95 (-0.31%) |
15.97 |
15.60 - 16.00 |
0.5023 times |
Mon 29 September 2025 |
16.00 (0.19%) |
15.76 |
15.51 - 16.00 |
0.5023 times |
Fri 26 September 2025 |
15.97 (3.17%) |
15.59 |
15.50 - 16.00 |
1.5525 times |
Tue 16 September 2025 |
15.48 (-1.15%) |
15.48 |
15.48 - 15.50 |
0.411 times |
Fri 12 September 2025 |
15.66 (-0.25%) |
15.70 |
15.40 - 15.70 |
0.3653 times |
Fri 05 September 2025 |
15.70 (1.36%) |
15.71 |
15.28 - 16.00 |
1.7808 times |
Mon 18 August 2025 |
15.49 (-1.34%) |
15.64 |
15.15 - 15.64 |
0.3653 times |
Fri 15 August 2025 |
15.70 (1.16%) |
15.79 |
15.70 - 15.79 |
0.2283 times |
Wed 30 July 2025 |
15.52 (-1.21%) |
15.71 |
15.14 - 16.33 |
1.9178 times |
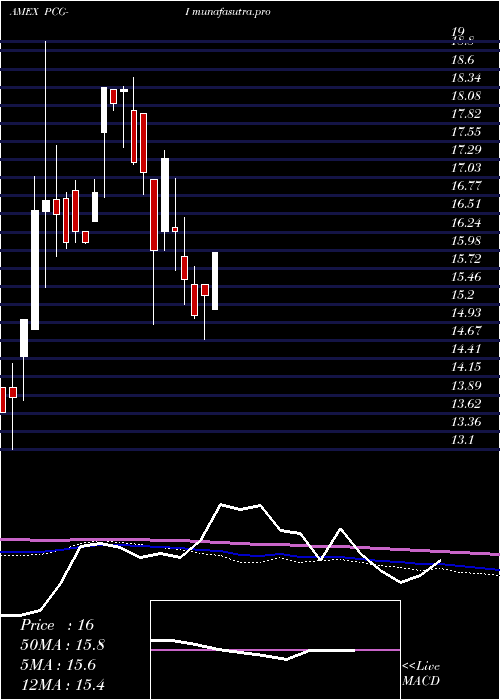
Monthly price and charts PacificGas Strong monthly Stock price targets for PacificGas PCG-I are 16.13 and 17.29 | Monthly Target 1 | 15.16 | | Monthly Target 2 | 15.94 | | Monthly Target 3 | 16.323333333333 | | Monthly Target 4 | 17.1 | | Monthly Target 5 | 17.48 |
Monthly price and volumes Pacific Gas
| Date |
Closing |
Open |
Range |
Volume |
Thu 23 October 2025 |
16.71 (4.44%) |
15.97 |
15.55 - 16.71 |
1.0541 times |
Mon 29 September 2025 |
16.00 (0.19%) |
15.70 |
15.40 - 16.00 |
0.6425 times |
Wed 27 August 2025 |
15.97 (2.9%) |
15.79 |
15.15 - 16.00 |
0.5019 times |
Wed 30 July 2025 |
15.52 (1.31%) |
15.12 |
15.01 - 16.33 |
1.0957 times |
Mon 30 June 2025 |
15.32 (1.86%) |
15.49 |
14.69 - 15.49 |
2.5097 times |
Fri 30 May 2025 |
15.04 (-3.34%) |
15.49 |
15.00 - 15.75 |
0.4517 times |
Wed 30 April 2025 |
15.56 (-4.25%) |
15.89 |
15.20 - 16.46 |
0.522 times |
Fri 28 March 2025 |
16.25 (-6.12%) |
16.31 |
15.69 - 17.02 |
0.4819 times |
Wed 26 February 2025 |
17.31 (8.39%) |
16.25 |
15.97 - 17.42 |
1.4255 times |
Fri 31 January 2025 |
15.97 (-6.66%) |
17.00 |
14.91 - 17.00 |
1.3151 times |
Fri 27 December 2024 |
17.11 (-0.81%) |
17.96 |
16.79 - 17.96 |
0.2425 times |
DMA SMA EMA moving averages of Pacific Gas PCG-I
DMA (daily moving average) of Pacific Gas PCG-I
| DMA period | DMA value | | 5 day DMA | 16.4 | | 12 day DMA | 16.15 | | 20 day DMA | 15.97 | | 35 day DMA | 15.79 | | 50 day DMA | 15.66 | | 100 day DMA | 15.93 | | 150 day DMA | 16.37 | | 200 day DMA | 16.31 | EMA (exponential moving average) of Pacific Gas PCG-I
| EMA period | EMA current | EMA prev | EMA prev2 | | 5 day EMA | 16.42 | 16.27 | 16.23 | | 12 day EMA | 16.2 | 16.11 | 16.06 | | 20 day EMA | 16.04 | 15.97 | 15.93 | | 35 day EMA | 15.85 | 15.8 | 15.77 | | 50 day EMA | 15.7 | 15.66 | 15.63 |
SMA (simple moving average) of Pacific Gas PCG-I
| SMA period | SMA current | SMA prev | SMA prev2 | | 5 day SMA | 16.4 | 16.26 | 16.16 | | 12 day SMA | 16.15 | 16.09 | 16.06 | | 20 day SMA | 15.97 | 15.92 | 15.9 | | 35 day SMA | 15.79 | 15.75 | 15.73 | | 50 day SMA | 15.66 | 15.63 | 15.61 | | 100 day SMA | 15.93 | 15.94 | 15.95 | | 150 day SMA | 16.37 | 16.37 | 16.37 | | 200 day SMA | 16.31 | 16.3 | 16.29 |
|
|
