PacificGas PCG-H full analysis,charts,indicators,moving averages,SMA,DMA,EMA,ADX,MACD,RSIPacific Gas PCG-H WideScreen charts, DMA,SMA,EMA technical analysis, forecast prediction, by indicators ADX,MACD,RSI,CCI AMEX stock exchange
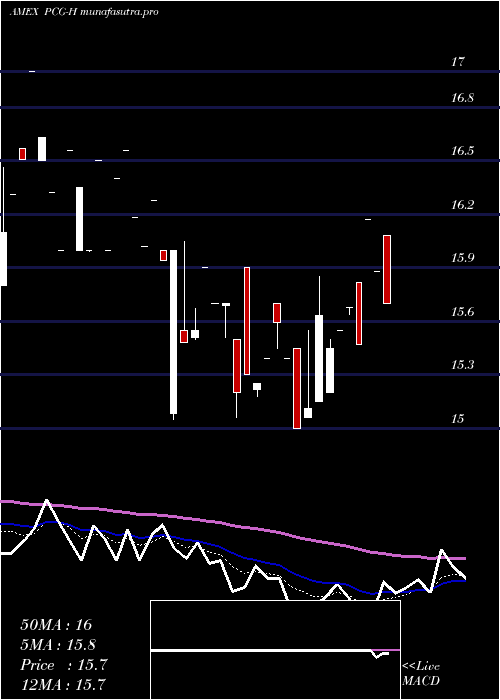
Daily price and charts and targets PacificGas Strong Daily Stock price targets for PacificGas PCG-H are 17.04 and 17.97 | Daily Target 1 | 16.26 | | Daily Target 2 | 16.88 | | Daily Target 3 | 17.19 | | Daily Target 4 | 17.81 | | Daily Target 5 | 18.12 |
Daily price and volume Pacific Gas
| Date |
Closing |
Open |
Range |
Volume |
Fri 24 October 2025 |
17.50 (5.61%) |
16.61 |
16.57 - 17.50 |
3.4946 times |
Thu 23 October 2025 |
16.57 (-2.76%) |
16.98 |
16.54 - 16.98 |
0.6989 times |
Wed 22 October 2025 |
17.04 (-2.07%) |
16.80 |
16.70 - 17.04 |
1.129 times |
Tue 21 October 2025 |
17.40 (5.01%) |
17.21 |
17.12 - 17.40 |
0.8065 times |
Fri 17 October 2025 |
16.57 (1.41%) |
16.57 |
16.57 - 16.57 |
0.1075 times |
Thu 16 October 2025 |
16.34 (-2.16%) |
17.39 |
16.34 - 17.40 |
1.5591 times |
Wed 15 October 2025 |
16.70 (0.36%) |
17.29 |
16.70 - 17.34 |
1.4516 times |
Tue 14 October 2025 |
16.64 (-0.06%) |
16.64 |
16.64 - 16.64 |
0.0538 times |
Mon 13 October 2025 |
16.65 (-1.89%) |
16.91 |
16.65 - 16.92 |
0.5376 times |
Fri 10 October 2025 |
16.97 (-0.18%) |
16.97 |
16.97 - 16.97 |
0.1613 times |
Thu 09 October 2025 |
17.00 (4.29%) |
17.00 |
17.00 - 17.33 |
4.8387 times |
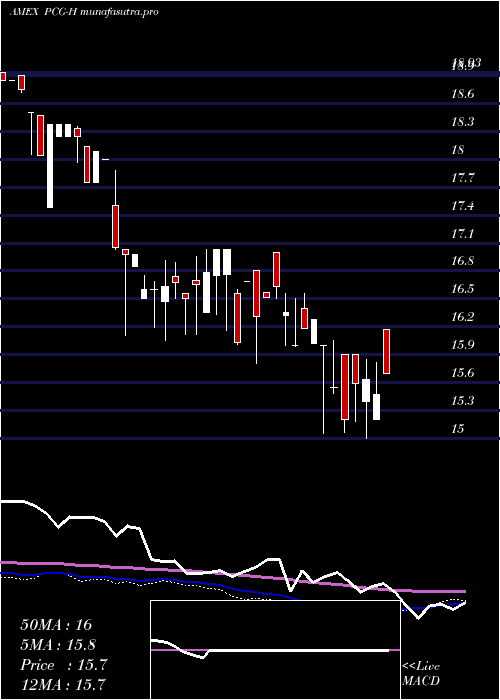
Weekly price and charts PacificGas Strong weekly Stock price targets for PacificGas PCG-H are 17.02 and 17.98 | Weekly Target 1 | 16.22 | | Weekly Target 2 | 16.86 | | Weekly Target 3 | 17.18 | | Weekly Target 4 | 17.82 | | Weekly Target 5 | 18.14 |
Weekly price and volumes for Pacific Gas
| Date |
Closing |
Open |
Range |
Volume |
Fri 24 October 2025 |
17.50 (5.61%) |
17.21 |
16.54 - 17.50 |
1.9289 times |
Fri 17 October 2025 |
16.57 (-2.36%) |
16.91 |
16.34 - 17.40 |
1.1675 times |
Fri 10 October 2025 |
16.97 (6.06%) |
16.45 |
16.00 - 17.33 |
1.9966 times |
Fri 03 October 2025 |
16.00 (-3.03%) |
16.40 |
15.51 - 16.50 |
0.643 times |
Fri 26 September 2025 |
16.50 (0.06%) |
16.20 |
16.01 - 16.50 |
1.4721 times |
Thu 18 September 2025 |
16.49 (0.49%) |
16.47 |
16.30 - 16.49 |
1.6582 times |
Fri 12 September 2025 |
16.41 (-0.55%) |
15.97 |
15.51 - 16.41 |
0.3215 times |
Fri 05 September 2025 |
16.50 (3.13%) |
16.24 |
16.24 - 16.66 |
0.3046 times |
Fri 29 August 2025 |
16.00 (0%) |
16.08 |
16.00 - 16.08 |
0.1354 times |
Fri 29 August 2025 |
16.00 (-1.72%) |
16.25 |
16.00 - 16.25 |
0.3723 times |
Fri 22 August 2025 |
16.28 (0.25%) |
15.86 |
15.86 - 16.28 |
0.3553 times |
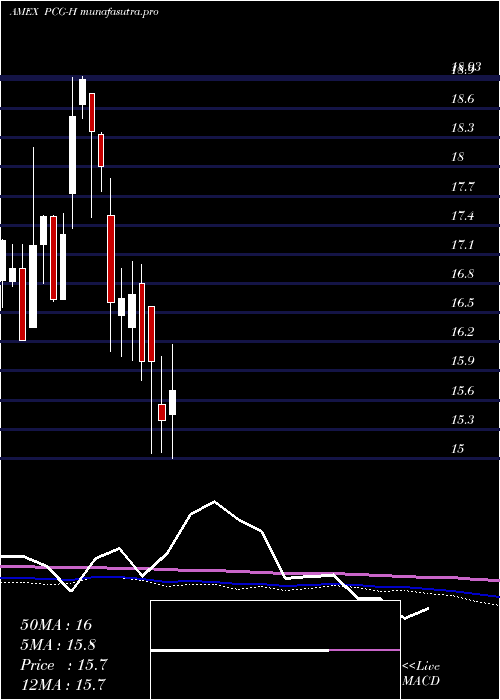
Monthly price and charts PacificGas Strong monthly Stock price targets for PacificGas PCG-H are 16.51 and 18.5 | Monthly Target 1 | 14.85 | | Monthly Target 2 | 16.17 | | Monthly Target 3 | 16.836666666667 | | Monthly Target 4 | 18.16 | | Monthly Target 5 | 18.83 |
Monthly price and volumes Pacific Gas
| Date |
Closing |
Open |
Range |
Volume |
Fri 24 October 2025 |
17.50 (6.06%) |
16.20 |
15.51 - 17.50 |
1.3724 times |
Tue 30 September 2025 |
16.50 (3.13%) |
16.24 |
15.51 - 16.66 |
1.0113 times |
Fri 29 August 2025 |
16.00 (0.31%) |
15.80 |
15.66 - 16.28 |
0.5864 times |
Tue 29 July 2025 |
15.95 (3.64%) |
15.45 |
15.00 - 16.17 |
1.2816 times |
Mon 30 June 2025 |
15.39 (-3.81%) |
15.55 |
15.06 - 16.05 |
1.8215 times |
Fri 30 May 2025 |
16.00 (0%) |
16.56 |
15.05 - 16.56 |
0.3141 times |
Wed 30 April 2025 |
16.00 (-4.13%) |
16.80 |
15.80 - 17.00 |
0.5067 times |
Mon 31 March 2025 |
16.69 (0.24%) |
16.35 |
16.01 - 17.03 |
0.8114 times |
Fri 28 February 2025 |
16.65 (0.3%) |
16.47 |
16.05 - 16.95 |
1.3555 times |
Thu 30 January 2025 |
16.60 (-7.78%) |
17.50 |
16.10 - 17.88 |
0.939 times |
Mon 30 December 2024 |
18.00 (-2.01%) |
18.33 |
17.75 - 18.35 |
0.2227 times |
DMA SMA EMA moving averages of Pacific Gas PCG-H
DMA (daily moving average) of Pacific Gas PCG-H
| DMA period | DMA value | | 5 day DMA | 17.02 | | 12 day DMA | 16.81 | | 20 day DMA | 16.62 | | 35 day DMA | 16.45 | | 50 day DMA | 16.26 | | 100 day DMA | 16.22 | | 150 day DMA | 16.67 | | 200 day DMA | 16.89 | EMA (exponential moving average) of Pacific Gas PCG-H
| EMA period | EMA current | EMA prev | EMA prev2 | | 5 day EMA | 17.03 | 16.8 | 16.91 | | 12 day EMA | 16.83 | 16.71 | 16.73 | | 20 day EMA | 16.69 | 16.6 | 16.6 | | 35 day EMA | 16.46 | 16.4 | 16.39 | | 50 day EMA | 16.25 | 16.2 | 16.19 |
SMA (simple moving average) of Pacific Gas PCG-H
| SMA period | SMA current | SMA prev | SMA prev2 | | 5 day SMA | 17.02 | 16.78 | 16.81 | | 12 day SMA | 16.81 | 16.7 | 16.66 | | 20 day SMA | 16.62 | 16.57 | 16.56 | | 35 day SMA | 16.45 | 16.4 | 16.39 | | 50 day SMA | 16.26 | 16.22 | 16.2 | | 100 day SMA | 16.22 | 16.22 | 16.21 | | 150 day SMA | 16.67 | 16.67 | 16.69 | | 200 day SMA | 16.89 | 16.89 | 16.89 |
|
|
