PacificGas PCG-G full analysis,charts,indicators,moving averages,SMA,DMA,EMA,ADX,MACD,RSIPacific Gas PCG-G WideScreen charts, DMA,SMA,EMA technical analysis, forecast prediction, by indicators ADX,MACD,RSI,CCI AMEX stock exchange
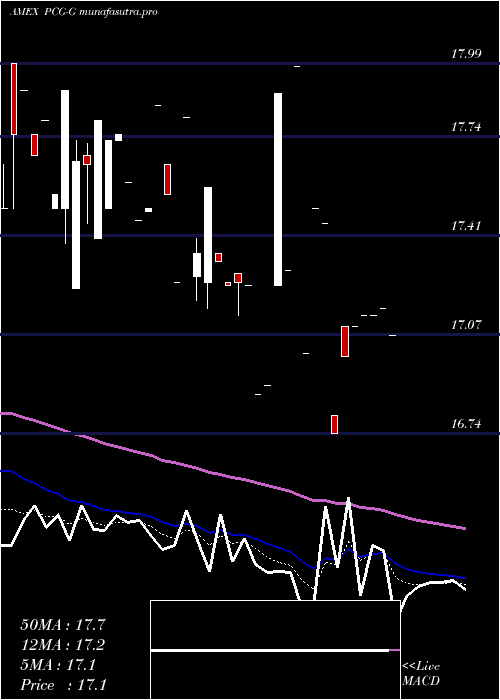
Daily price and charts and targets PacificGas Strong Daily Stock price targets for PacificGas PCG-G are 17.99 and 18.41 | Daily Target 1 | 17.64 | | Daily Target 2 | 17.92 | | Daily Target 3 | 18.06 | | Daily Target 4 | 18.34 | | Daily Target 5 | 18.48 |
Daily price and volume Pacific Gas
| Date |
Closing |
Open |
Range |
Volume |
Wed 22 October 2025 |
18.20 (2.82%) |
17.99 |
17.78 - 18.20 |
1.4397 times |
Tue 21 October 2025 |
17.70 (-0.28%) |
17.70 |
17.43 - 17.70 |
0.8949 times |
Mon 20 October 2025 |
17.75 (0.28%) |
18.63 |
17.75 - 18.63 |
0.2335 times |
Wed 15 October 2025 |
17.70 (-1.39%) |
17.52 |
17.47 - 18.65 |
3.9689 times |
Tue 14 October 2025 |
17.95 (-1.16%) |
17.60 |
17.60 - 17.95 |
0.1556 times |
Mon 13 October 2025 |
18.16 (-0.22%) |
18.44 |
17.96 - 18.70 |
0.8949 times |
Fri 10 October 2025 |
18.20 (0.83%) |
18.25 |
18.20 - 18.25 |
1.4008 times |
Thu 09 October 2025 |
18.05 (0.56%) |
17.17 |
17.17 - 18.05 |
0.1946 times |
Wed 08 October 2025 |
17.95 (0%) |
17.97 |
17.55 - 17.97 |
0.1946 times |
Tue 07 October 2025 |
17.95 (2.28%) |
17.56 |
17.56 - 17.99 |
0.6226 times |
Mon 06 October 2025 |
17.55 (-0.28%) |
17.70 |
17.17 - 17.70 |
0.9728 times |
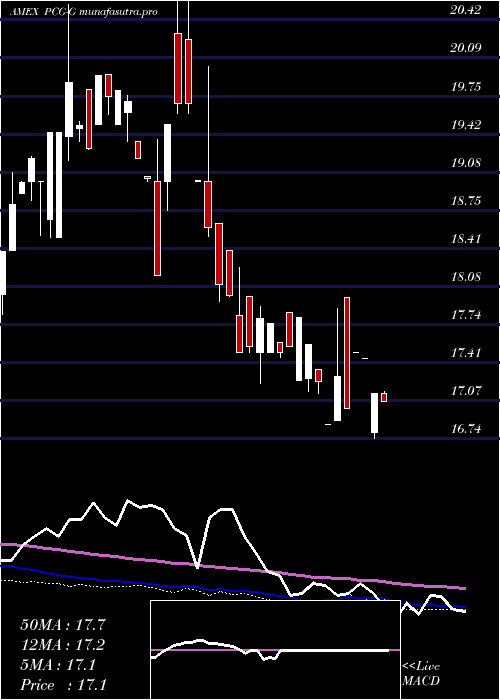
Weekly price and charts PacificGas Strong weekly Stock price targets for PacificGas PCG-G are 17.22 and 18.42 | Weekly Target 1 | 16.89 | | Weekly Target 2 | 17.54 | | Weekly Target 3 | 18.086666666667 | | Weekly Target 4 | 18.74 | | Weekly Target 5 | 19.29 |
Weekly price and volumes for Pacific Gas
| Date |
Closing |
Open |
Range |
Volume |
Wed 22 October 2025 |
18.20 (2.82%) |
18.63 |
17.43 - 18.63 |
0.8788 times |
Wed 15 October 2025 |
17.70 (-2.75%) |
18.44 |
17.47 - 18.70 |
1.7177 times |
Fri 10 October 2025 |
18.20 (3.41%) |
17.70 |
17.17 - 18.25 |
1.1585 times |
Fri 03 October 2025 |
17.60 (-1.68%) |
17.82 |
17.18 - 18.05 |
1.3182 times |
Fri 26 September 2025 |
17.90 (6.48%) |
17.22 |
17.19 - 17.90 |
0.7057 times |
Fri 19 September 2025 |
16.81 (-3.67%) |
17.10 |
16.73 - 17.50 |
1.6112 times |
Thu 11 September 2025 |
17.45 (6.73%) |
16.75 |
16.50 - 17.50 |
1.0786 times |
Fri 05 September 2025 |
16.35 (-2.27%) |
16.86 |
16.35 - 16.86 |
0.4394 times |
Fri 29 August 2025 |
16.73 (0%) |
16.81 |
16.73 - 16.81 |
0.2264 times |
Fri 29 August 2025 |
16.73 (0.12%) |
17.20 |
16.68 - 17.25 |
0.8655 times |
Fri 22 August 2025 |
16.71 (0.18%) |
16.77 |
16.30 - 17.00 |
0.7856 times |
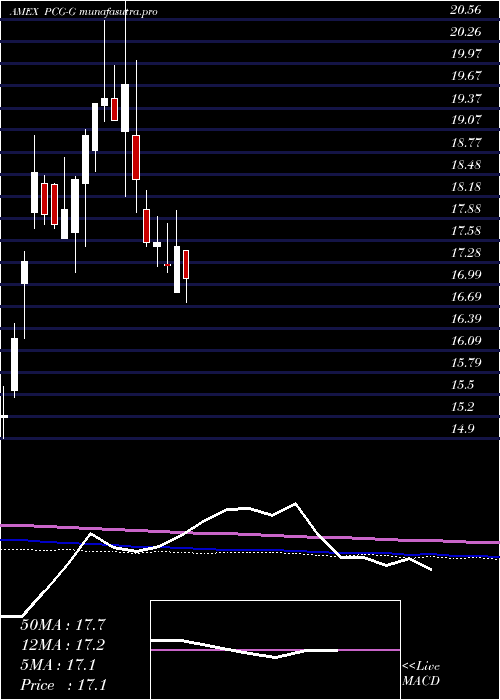
Monthly price and charts PacificGas Strong monthly Stock price targets for PacificGas PCG-G are 17.69 and 19.22 | Monthly Target 1 | 16.49 | | Monthly Target 2 | 17.35 | | Monthly Target 3 | 18.023333333333 | | Monthly Target 4 | 18.88 | | Monthly Target 5 | 19.55 |
Monthly price and volumes Pacific Gas
| Date |
Closing |
Open |
Range |
Volume |
Wed 22 October 2025 |
18.20 (5.2%) |
17.38 |
17.17 - 18.70 |
2.3016 times |
Tue 30 September 2025 |
17.30 (3.41%) |
16.86 |
16.35 - 18.05 |
2.2271 times |
Fri 29 August 2025 |
16.73 (-0.12%) |
17.00 |
16.30 - 17.25 |
1.4419 times |
Wed 30 July 2025 |
16.75 (1.52%) |
16.62 |
16.49 - 17.00 |
0.616 times |
Fri 13 June 2025 |
16.50 (-4.35%) |
16.58 |
16.50 - 17.00 |
0.1218 times |
Tue 27 May 2025 |
17.25 (-1.43%) |
17.45 |
16.74 - 17.45 |
0.3926 times |
Tue 29 April 2025 |
17.50 (1.51%) |
16.87 |
16.87 - 17.98 |
0.2302 times |
Fri 21 March 2025 |
17.24 (-1.77%) |
17.25 |
17.14 - 17.81 |
0.6176 times |
Fri 28 February 2025 |
17.55 (0%) |
17.50 |
17.23 - 17.90 |
1.3133 times |
Fri 31 January 2025 |
17.55 (-4.62%) |
18.00 |
17.50 - 18.25 |
0.7379 times |
Mon 30 December 2024 |
18.40 (-6.55%) |
19.00 |
17.95 - 20.01 |
1.6358 times |
DMA SMA EMA moving averages of Pacific Gas PCG-G
DMA (daily moving average) of Pacific Gas PCG-G
| DMA period | DMA value | | 5 day DMA | 17.86 | | 12 day DMA | 17.9 | | 20 day DMA | 17.78 | | 35 day DMA | 17.44 | | 50 day DMA | 17.26 | | 100 day DMA | 17.31 | | 150 day DMA | 17.98 | | 200 day DMA | 18.01 | EMA (exponential moving average) of Pacific Gas PCG-G
| EMA period | EMA current | EMA prev | EMA prev2 | | 5 day EMA | 17.93 | 17.8 | 17.85 | | 12 day EMA | 17.84 | 17.78 | 17.8 | | 20 day EMA | 17.73 | 17.68 | 17.68 | | 35 day EMA | 17.52 | 17.48 | 17.47 | | 50 day EMA | 17.27 | 17.23 | 17.21 |
SMA (simple moving average) of Pacific Gas PCG-G
| SMA period | SMA current | SMA prev | SMA prev2 | | 5 day SMA | 17.86 | 17.85 | 17.95 | | 12 day SMA | 17.9 | 17.81 | 17.78 | | 20 day SMA | 17.78 | 17.71 | 17.69 | | 35 day SMA | 17.44 | 17.39 | 17.36 | | 50 day SMA | 17.26 | 17.22 | 17.21 | | 100 day SMA | 17.31 | 17.32 | 17.32 | | 150 day SMA | 17.98 | 17.99 | 17.99 | | 200 day SMA | 18.01 | 18.01 | 18.01 |
|
|
