PacificGas PCG-E full analysis,charts,indicators,moving averages,SMA,DMA,EMA,ADX,MACD,RSIPacific Gas PCG-E WideScreen charts, DMA,SMA,EMA technical analysis, forecast prediction, by indicators ADX,MACD,RSI,CCI AMEX stock exchange
Daily price and charts and targets PacificGas Strong Daily Stock price targets for PacificGas PCG-E are 19.58 and 19.82 | Daily Target 1 | 19.54 | | Daily Target 2 | 19.62 | | Daily Target 3 | 19.78 | | Daily Target 4 | 19.86 | | Daily Target 5 | 20.02 |
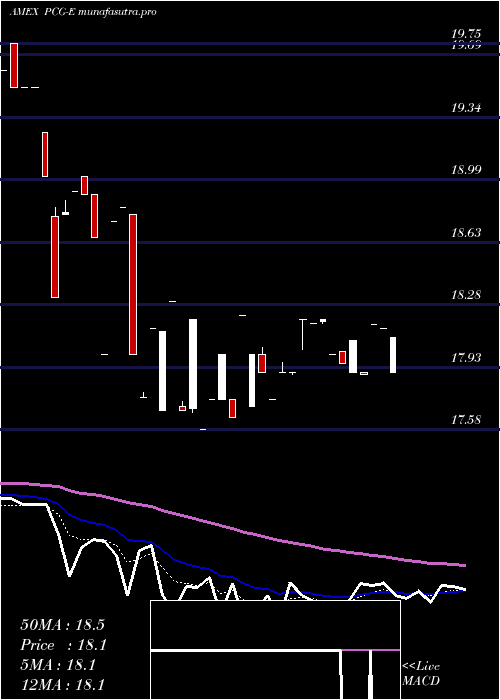
Daily price and volume Pacific Gas
| Date |
Closing |
Open |
Range |
Volume |
Fri 24 October 2025 |
19.70 (-0.35%) |
19.94 |
19.70 - 19.94 |
0.1327 times |
Wed 22 October 2025 |
19.77 (-0.95%) |
19.85 |
18.99 - 20.00 |
0.5752 times |
Tue 21 October 2025 |
19.96 (9.01%) |
18.39 |
18.27 - 19.96 |
4.9558 times |
Mon 20 October 2025 |
18.31 (0.83%) |
18.21 |
18.21 - 18.31 |
0.531 times |
Fri 17 October 2025 |
18.16 (0.06%) |
18.16 |
18.16 - 18.16 |
0.0885 times |
Thu 16 October 2025 |
18.15 (0.67%) |
18.20 |
18.12 - 18.20 |
0.3097 times |
Wed 15 October 2025 |
18.03 (-0.17%) |
18.20 |
18.03 - 18.20 |
1.7699 times |
Tue 14 October 2025 |
18.06 (-2.9%) |
17.70 |
17.69 - 18.42 |
0.7965 times |
Mon 13 October 2025 |
18.60 (0.22%) |
18.39 |
18.20 - 18.60 |
0.2212 times |
Fri 10 October 2025 |
18.56 (0.81%) |
18.81 |
18.39 - 18.81 |
0.6195 times |
Thu 09 October 2025 |
18.41 (0.27%) |
18.11 |
18.11 - 18.41 |
0.2212 times |
Weekly price and charts PacificGas Strong weekly Stock price targets for PacificGas PCG-E are 18.96 and 20.75 | Weekly Target 1 | 17.51 | | Weekly Target 2 | 18.61 | | Weekly Target 3 | 19.303333333333 | | Weekly Target 4 | 20.4 | | Weekly Target 5 | 21.09 |
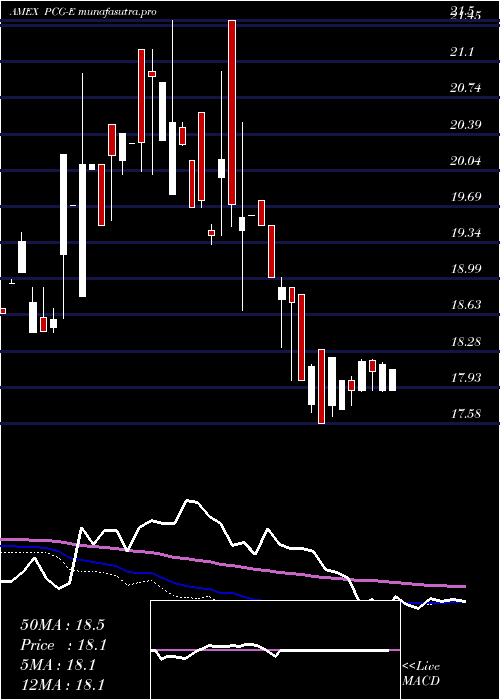
Weekly price and volumes for Pacific Gas
| Date |
Closing |
Open |
Range |
Volume |
Fri 24 October 2025 |
19.70 (8.48%) |
18.21 |
18.21 - 20.00 |
2.4518 times |
Fri 17 October 2025 |
18.16 (-2.16%) |
18.39 |
17.69 - 18.60 |
1.2609 times |
Fri 10 October 2025 |
18.56 (3.4%) |
18.00 |
18.00 - 18.81 |
0.6305 times |
Fri 03 October 2025 |
17.95 (-0.33%) |
18.31 |
17.95 - 18.47 |
0.6655 times |
Fri 26 September 2025 |
18.01 (2.04%) |
18.01 |
17.90 - 18.81 |
1.1384 times |
Fri 19 September 2025 |
17.65 (0.86%) |
17.80 |
17.51 - 17.99 |
1.5061 times |
Tue 09 September 2025 |
17.50 (0.46%) |
17.55 |
17.50 - 17.55 |
0.1226 times |
Fri 05 September 2025 |
17.42 (-1.58%) |
17.70 |
17.42 - 17.70 |
0.5779 times |
Thu 28 August 2025 |
17.70 (0.4%) |
17.70 |
17.45 - 17.79 |
0.4378 times |
Fri 15 August 2025 |
17.63 (-3.13%) |
17.89 |
17.41 - 17.89 |
1.2084 times |
Thu 07 August 2025 |
18.20 (5.81%) |
17.45 |
17.45 - 18.20 |
0.5779 times |
Monthly price and charts PacificGas Strong monthly Stock price targets for PacificGas PCG-E are 18.7 and 21.01 | Monthly Target 1 | 16.82 | | Monthly Target 2 | 18.26 | | Monthly Target 3 | 19.13 | | Monthly Target 4 | 20.57 | | Monthly Target 5 | 21.44 |
Monthly price and volumes Pacific Gas
| Date |
Closing |
Open |
Range |
Volume |
Fri 24 October 2025 |
19.70 (6.78%) |
18.37 |
17.69 - 20.00 |
1.8643 times |
Tue 30 September 2025 |
18.45 (4.24%) |
17.70 |
17.42 - 18.81 |
1.6368 times |
Thu 28 August 2025 |
17.70 (2.79%) |
17.27 |
17.19 - 18.20 |
1.1377 times |
Thu 31 July 2025 |
17.22 (-4.81%) |
17.73 |
17.06 - 18.00 |
1.3602 times |
Fri 27 June 2025 |
18.09 (1.06%) |
17.86 |
17.56 - 18.15 |
0.4845 times |
Wed 28 May 2025 |
17.90 (-0.56%) |
18.12 |
17.60 - 18.15 |
0.6246 times |
Tue 29 April 2025 |
18.00 (-1.1%) |
18.00 |
17.70 - 18.17 |
0.6973 times |
Mon 31 March 2025 |
18.20 (-0.11%) |
17.71 |
17.71 - 18.20 |
0.5652 times |
Fri 21 February 2025 |
18.22 (1.22%) |
17.76 |
17.58 - 18.30 |
0.6312 times |
Thu 30 January 2025 |
18.00 (-8.16%) |
19.75 |
18.00 - 19.75 |
0.9982 times |
Mon 30 December 2024 |
19.60 (0.98%) |
19.97 |
18.68 - 21.50 |
0.8241 times |

DMA SMA EMA moving averages of Pacific Gas PCG-E
DMA (daily moving average) of Pacific Gas PCG-E
| DMA period | DMA value | | 5 day DMA | 19.18 | | 12 day DMA | 18.67 | | 20 day DMA | 18.47 | | 35 day DMA | 18.15 | | 50 day DMA | 17.96 | | 100 day DMA | 17.94 | | 150 day DMA | 18.59 | | 200 day DMA | 18.71 | EMA (exponential moving average) of Pacific Gas PCG-E
| EMA period | EMA current | EMA prev | EMA prev2 | | 5 day EMA | 19.32 | 19.13 | 18.81 | | 12 day EMA | 18.85 | 18.69 | 18.49 | | 20 day EMA | 18.6 | 18.48 | 18.34 | | 35 day EMA | 18.32 | 18.24 | 18.15 | | 50 day EMA | 18.09 | 18.02 | 17.95 |
SMA (simple moving average) of Pacific Gas PCG-E
| SMA period | SMA current | SMA prev | SMA prev2 | | 5 day SMA | 19.18 | 18.87 | 18.52 | | 12 day SMA | 18.67 | 18.56 | 18.46 | | 20 day SMA | 18.47 | 18.38 | 18.31 | | 35 day SMA | 18.15 | 18.09 | 18.05 | | 50 day SMA | 17.96 | 17.93 | 17.88 | | 100 day SMA | 17.94 | 17.93 | 17.92 | | 150 day SMA | 18.59 | 18.59 | 18.59 | | 200 day SMA | 18.71 | 18.71 | 18.7 |
|
|
