PacificGas PCG-C full analysis,charts,indicators,moving averages,SMA,DMA,EMA,ADX,MACD,RSIPacific Gas PCG-C WideScreen charts, DMA,SMA,EMA technical analysis, forecast prediction, by indicators ADX,MACD,RSI,CCI AMEX stock exchange
Daily price and charts and targets PacificGas Strong Daily Stock price targets for PacificGas PCG-C are 19.79 and 19.79 | Daily Target 1 | 19.79 | | Daily Target 2 | 19.79 | | Daily Target 3 | 19.79 | | Daily Target 4 | 19.79 | | Daily Target 5 | 19.79 |
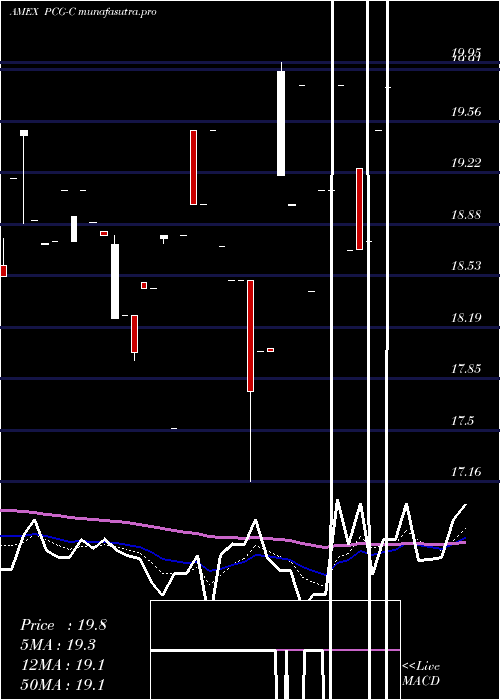
Daily price and volume Pacific Gas
| Date |
Closing |
Open |
Range |
Volume |
Thu 23 October 2025 |
19.79 (1.49%) |
19.79 |
19.79 - 19.79 |
0.3571 times |
Tue 21 October 2025 |
19.50 (3.94%) |
19.50 |
19.50 - 19.50 |
0.3571 times |
Tue 14 October 2025 |
18.76 (0.27%) |
18.76 |
18.76 - 18.76 |
0.3571 times |
Mon 13 October 2025 |
18.71 (0.05%) |
19.25 |
18.71 - 19.25 |
2.1429 times |
Wed 08 October 2025 |
18.70 (-5.56%) |
18.70 |
18.70 - 18.70 |
0.3571 times |
Tue 07 October 2025 |
19.80 (3.66%) |
19.80 |
19.80 - 19.80 |
0.7143 times |
Tue 23 September 2025 |
19.10 (0%) |
19.10 |
19.10 - 19.10 |
1.0714 times |
Mon 15 September 2025 |
19.10 (3.64%) |
19.10 |
19.10 - 19.10 |
3.5714 times |
Thu 11 September 2025 |
18.43 (-6.92%) |
18.43 |
18.43 - 18.43 |
0.7143 times |
Wed 10 September 2025 |
19.80 (4.16%) |
19.80 |
19.80 - 19.80 |
0.3571 times |
Tue 09 September 2025 |
19.01 (-4.42%) |
19.00 |
19.00 - 19.01 |
4.2857 times |
Weekly price and charts PacificGas Strong weekly Stock price targets for PacificGas PCG-C are 19.65 and 19.94 | Weekly Target 1 | 19.4 | | Weekly Target 2 | 19.6 | | Weekly Target 3 | 19.693333333333 | | Weekly Target 4 | 19.89 | | Weekly Target 5 | 19.98 |
Weekly price and volumes for Pacific Gas
| Date |
Closing |
Open |
Range |
Volume |
Thu 23 October 2025 |
19.79 (5.49%) |
19.50 |
19.50 - 19.79 |
0.1942 times |
Tue 14 October 2025 |
18.76 (0.32%) |
19.25 |
18.71 - 19.25 |
0.6796 times |
Wed 08 October 2025 |
18.70 (-2.09%) |
19.80 |
18.70 - 19.80 |
0.2913 times |
Tue 23 September 2025 |
19.10 (3.64%) |
19.10 |
19.10 - 19.10 |
1.2621 times |
Thu 11 September 2025 |
18.43 (-7.34%) |
19.00 |
18.43 - 19.80 |
1.4563 times |
Fri 05 September 2025 |
19.89 (11.99%) |
18.03 |
18.03 - 19.95 |
4.5631 times |
Fri 22 August 2025 |
17.76 (-4%) |
18.50 |
17.16 - 18.50 |
0.9709 times |
Fri 15 August 2025 |
18.50 (0%) |
18.50 |
18.50 - 18.50 |
0.0971 times |
Fri 25 July 2025 |
18.50 (-5.13%) |
18.73 |
18.50 - 18.73 |
0.2913 times |
Tue 15 July 2025 |
19.50 (2.58%) |
19.50 |
19.50 - 19.50 |
0.1942 times |
Wed 02 July 2025 |
19.01 (0%) |
19.01 |
19.01 - 19.01 |
0.2913 times |

Monthly price and charts PacificGas Strong monthly Stock price targets for PacificGas PCG-C are 18.7 and 19.8 | Monthly Target 1 | 18.33 | | Monthly Target 2 | 19.06 | | Monthly Target 3 | 19.43 | | Monthly Target 4 | 20.16 | | Monthly Target 5 | 20.53 |
Monthly price and volumes Pacific Gas
| Date |
Closing |
Open |
Range |
Volume |
Thu 23 October 2025 |
19.79 (3.61%) |
19.80 |
18.70 - 19.80 |
0.3149 times |
Tue 23 September 2025 |
19.10 (5.93%) |
18.05 |
18.03 - 19.95 |
1.8894 times |
Tue 26 August 2025 |
18.03 (-2.54%) |
18.50 |
17.16 - 18.50 |
0.3674 times |
Fri 25 July 2025 |
18.50 (-2.68%) |
19.01 |
18.50 - 19.50 |
0.2099 times |
Fri 27 June 2025 |
19.01 (3.04%) |
18.78 |
17.52 - 19.50 |
0.7348 times |
Tue 20 May 2025 |
18.45 (-1.55%) |
18.27 |
17.97 - 18.49 |
0.3944 times |
Tue 29 April 2025 |
18.74 (-1.88%) |
18.76 |
18.25 - 19.10 |
1.0496 times |
Wed 26 March 2025 |
19.10 (-2.55%) |
19.05 |
18.53 - 19.50 |
2.1255 times |
Fri 28 February 2025 |
19.60 (4.53%) |
18.51 |
18.50 - 20.00 |
2.0206 times |
Mon 27 January 2025 |
18.75 (-10.24%) |
20.57 |
18.75 - 21.14 |
0.8935 times |
Fri 20 December 2024 |
20.89 (4.97%) |
20.60 |
20.41 - 24.00 |
4.5859 times |

DMA SMA EMA moving averages of Pacific Gas PCG-C
DMA (daily moving average) of Pacific Gas PCG-C
| DMA period | DMA value | | 5 day DMA | 19.09 | | 12 day DMA | 19.22 | | 20 day DMA | 18.93 | | 35 day DMA | 18.81 | | 50 day DMA | 18.9 | | 100 day DMA | 19.58 | | 150 day DMA | 19.32 | | 200 day DMA | 18.98 | EMA (exponential moving average) of Pacific Gas PCG-C
| EMA period | EMA current | EMA prev | EMA prev2 | | 5 day EMA | 19.32 | 19.09 | 18.89 | | 12 day EMA | 19.12 | 19 | 18.91 | | 20 day EMA | 19 | 18.92 | 18.86 | | 35 day EMA | 18.97 | 18.92 | 18.89 | | 50 day EMA | 18.93 | 18.89 | 18.87 |
SMA (simple moving average) of Pacific Gas PCG-C
| SMA period | SMA current | SMA prev | SMA prev2 | | 5 day SMA | 19.09 | 19.09 | 19.01 | | 12 day SMA | 19.22 | 19.07 | 18.95 | | 20 day SMA | 18.93 | 18.89 | 18.86 | | 35 day SMA | 18.81 | 18.78 | 18.76 | | 50 day SMA | 18.9 | 18.89 | 18.89 | | 100 day SMA | 19.58 | 19.58 | 19.57 | | 150 day SMA | 19.32 | 19.31 | 19.31 | | 200 day SMA | 18.98 | 18.96 | 18.94 |
|
|
