PacificGas PCG-B full analysis,charts,indicators,moving averages,SMA,DMA,EMA,ADX,MACD,RSIPacific Gas PCG-B WideScreen charts, DMA,SMA,EMA technical analysis, forecast prediction, by indicators ADX,MACD,RSI,CCI AMEX stock exchange
Daily price and charts and targets PacificGas Strong Daily Stock price targets for PacificGas PCG-B are 20.34 and 20.56 | Daily Target 1 | 20.16 | | Daily Target 2 | 20.3 | | Daily Target 3 | 20.376666666667 | | Daily Target 4 | 20.52 | | Daily Target 5 | 20.6 |
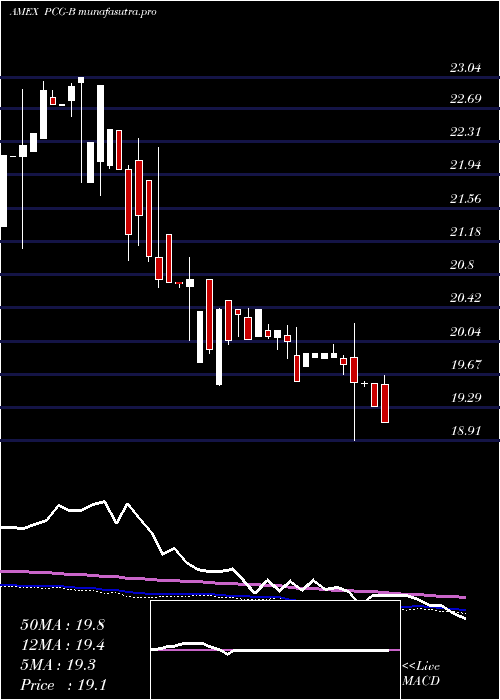
Daily price and volume Pacific Gas
| Date |
Closing |
Open |
Range |
Volume |
Fri 24 October 2025 |
20.45 (0.89%) |
20.39 |
20.23 - 20.45 |
0.5282 times |
Thu 23 October 2025 |
20.27 (0.5%) |
20.39 |
20.27 - 20.39 |
0.1056 times |
Wed 22 October 2025 |
20.17 (-0.15%) |
20.21 |
20.17 - 20.21 |
0.2465 times |
Tue 21 October 2025 |
20.20 (1%) |
20.08 |
19.93 - 20.20 |
0.3521 times |
Mon 20 October 2025 |
20.00 (0%) |
20.00 |
20.00 - 20.00 |
0.0352 times |
Fri 17 October 2025 |
20.00 (0.5%) |
19.90 |
19.90 - 20.00 |
0.493 times |
Thu 16 October 2025 |
19.90 (-0.25%) |
20.00 |
19.90 - 20.00 |
0.1761 times |
Wed 15 October 2025 |
19.95 (1.53%) |
19.75 |
19.65 - 19.96 |
4.0493 times |
Tue 14 October 2025 |
19.65 (-1.11%) |
19.77 |
19.65 - 19.80 |
1.1972 times |
Mon 13 October 2025 |
19.87 (0.61%) |
19.75 |
19.73 - 19.90 |
2.8169 times |
Fri 10 October 2025 |
19.75 (0.3%) |
20.00 |
19.65 - 20.00 |
5 times |

Weekly price and charts PacificGas Strong weekly Stock price targets for PacificGas PCG-B are 20.19 and 20.71 | Weekly Target 1 | 19.76 | | Weekly Target 2 | 20.1 | | Weekly Target 3 | 20.276666666667 | | Weekly Target 4 | 20.62 | | Weekly Target 5 | 20.8 |
Weekly price and volumes for Pacific Gas
| Date |
Closing |
Open |
Range |
Volume |
Fri 24 October 2025 |
20.45 (2.25%) |
20.00 |
19.93 - 20.45 |
0.1837 times |
Fri 17 October 2025 |
20.00 (1.27%) |
19.75 |
19.65 - 20.00 |
1.2653 times |
Fri 10 October 2025 |
19.75 (0.1%) |
19.73 |
19.55 - 20.00 |
1.8878 times |
Fri 03 October 2025 |
19.73 (-1.2%) |
19.55 |
19.55 - 19.90 |
1.2398 times |
Fri 26 September 2025 |
19.97 (1.37%) |
19.69 |
19.49 - 20.00 |
0.8827 times |
Fri 19 September 2025 |
19.70 (0%) |
19.68 |
19.52 - 19.85 |
1.4184 times |
Fri 12 September 2025 |
19.70 (1.29%) |
19.40 |
19.30 - 19.74 |
1.7602 times |
Fri 05 September 2025 |
19.45 (0.21%) |
19.32 |
19.32 - 19.60 |
0.7857 times |
Fri 29 August 2025 |
19.41 (0%) |
19.05 |
19.05 - 19.41 |
0.0153 times |
Fri 29 August 2025 |
19.41 (0.1%) |
20.08 |
19.05 - 20.08 |
0.5612 times |
Fri 22 August 2025 |
19.39 (-0.62%) |
19.50 |
19.26 - 19.55 |
1.449 times |
Monthly price and charts PacificGas Strong monthly Stock price targets for PacificGas PCG-B are 20 and 20.9 | Monthly Target 1 | 19.25 | | Monthly Target 2 | 19.85 | | Monthly Target 3 | 20.15 | | Monthly Target 4 | 20.75 | | Monthly Target 5 | 21.05 |
Monthly price and volumes Pacific Gas
| Date |
Closing |
Open |
Range |
Volume |
Fri 24 October 2025 |
20.45 (4.34%) |
19.55 |
19.55 - 20.45 |
1.8582 times |
Tue 30 September 2025 |
19.60 (0.98%) |
19.32 |
19.30 - 20.00 |
2.7797 times |
Fri 29 August 2025 |
19.41 (-0.41%) |
19.26 |
19.05 - 20.08 |
1.4338 times |
Thu 31 July 2025 |
19.49 (2.74%) |
19.01 |
18.94 - 19.60 |
0.58 times |
Mon 30 June 2025 |
18.97 (-0.73%) |
19.33 |
18.92 - 19.57 |
0.4043 times |
Fri 30 May 2025 |
19.11 (0.37%) |
18.91 |
18.91 - 20.25 |
0.8211 times |
Wed 30 April 2025 |
19.04 (-5.32%) |
20.22 |
19.04 - 20.22 |
0.5188 times |
Mon 31 March 2025 |
20.11 (0.25%) |
20.10 |
19.95 - 20.40 |
0.2129 times |
Fri 28 February 2025 |
20.06 (0.55%) |
19.55 |
19.54 - 20.50 |
0.4219 times |
Fri 31 January 2025 |
19.95 (-5.05%) |
21.00 |
19.80 - 22.25 |
0.9693 times |
Fri 27 December 2024 |
21.01 (-4.5%) |
21.89 |
20.95 - 22.35 |
0.3672 times |

DMA SMA EMA moving averages of Pacific Gas PCG-B
DMA (daily moving average) of Pacific Gas PCG-B
| DMA period | DMA value | | 5 day DMA | 20.22 | | 12 day DMA | 19.99 | | 20 day DMA | 19.88 | | 35 day DMA | 19.79 | | 50 day DMA | 19.7 | | 100 day DMA | 19.52 | | 150 day DMA | 19.68 | | 200 day DMA | 20.2 | EMA (exponential moving average) of Pacific Gas PCG-B
| EMA period | EMA current | EMA prev | EMA prev2 | | 5 day EMA | 20.24 | 20.14 | 20.07 | | 12 day EMA | 20.06 | 19.99 | 19.94 | | 20 day EMA | 19.95 | 19.9 | 19.86 | | 35 day EMA | 19.83 | 19.79 | 19.76 | | 50 day EMA | 19.73 | 19.7 | 19.68 |
SMA (simple moving average) of Pacific Gas PCG-B
| SMA period | SMA current | SMA prev | SMA prev2 | | 5 day SMA | 20.22 | 20.13 | 20.05 | | 12 day SMA | 19.99 | 19.93 | 19.88 | | 20 day SMA | 19.88 | 19.86 | 19.83 | | 35 day SMA | 19.79 | 19.76 | 19.74 | | 50 day SMA | 19.7 | 19.68 | 19.67 | | 100 day SMA | 19.52 | 19.51 | 19.51 | | 150 day SMA | 19.68 | 19.68 | 19.68 | | 200 day SMA | 20.2 | 20.21 | 20.22 |
|
|
