PacificGas PCG-A full analysis,charts,indicators,moving averages,SMA,DMA,EMA,ADX,MACD,RSIPacific Gas PCG-A WideScreen charts, DMA,SMA,EMA technical analysis, forecast prediction, by indicators ADX,MACD,RSI,CCI AMEX stock exchange
Daily price and charts and targets PacificGas Strong Daily Stock price targets for PacificGas PCG-A are 22.39 and 22.54 | Daily Target 1 | 22.28 | | Daily Target 2 | 22.35 | | Daily Target 3 | 22.426666666667 | | Daily Target 4 | 22.5 | | Daily Target 5 | 22.58 |
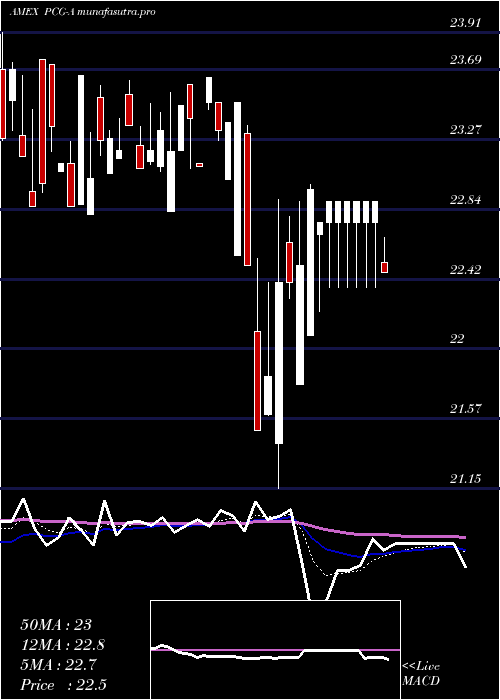
Daily price and volume Pacific Gas
| Date |
Closing |
Open |
Range |
Volume |
Thu 23 October 2025 |
22.43 (0.36%) |
22.35 |
22.35 - 22.50 |
1.5015 times |
Wed 22 October 2025 |
22.35 (-0.4%) |
22.40 |
22.30 - 22.45 |
1.3413 times |
Tue 21 October 2025 |
22.44 (0.81%) |
22.30 |
22.25 - 22.45 |
3.8238 times |
Mon 20 October 2025 |
22.26 (0%) |
22.30 |
22.26 - 22.31 |
0.4304 times |
Fri 17 October 2025 |
22.26 (0%) |
22.20 |
22.20 - 22.27 |
0.2803 times |
Thu 16 October 2025 |
22.26 (-0.36%) |
22.32 |
22.22 - 22.32 |
0.3103 times |
Wed 15 October 2025 |
22.34 (0.4%) |
22.35 |
22.25 - 22.39 |
0.6406 times |
Tue 14 October 2025 |
22.25 (-0.22%) |
22.30 |
22.22 - 22.95 |
0.3403 times |
Mon 13 October 2025 |
22.30 (-0.89%) |
22.45 |
22.30 - 22.45 |
0.2703 times |
Fri 10 October 2025 |
22.50 (0.58%) |
22.45 |
22.22 - 22.50 |
1.0611 times |
Thu 09 October 2025 |
22.37 (0.36%) |
22.30 |
22.30 - 22.40 |
0.5405 times |
Weekly price and charts PacificGas Strong weekly Stock price targets for PacificGas PCG-A are 22.34 and 22.59 | Weekly Target 1 | 22.14 | | Weekly Target 2 | 22.29 | | Weekly Target 3 | 22.393333333333 | | Weekly Target 4 | 22.54 | | Weekly Target 5 | 22.64 |
Weekly price and volumes for Pacific Gas
| Date |
Closing |
Open |
Range |
Volume |
Thu 23 October 2025 |
22.43 (0.76%) |
22.30 |
22.25 - 22.50 |
2.5961 times |
Fri 17 October 2025 |
22.26 (-1.07%) |
22.45 |
22.20 - 22.95 |
0.6737 times |
Fri 10 October 2025 |
22.50 (1.31%) |
22.20 |
22.18 - 22.50 |
0.9484 times |
Fri 03 October 2025 |
22.21 (-0.05%) |
22.17 |
21.60 - 22.26 |
1.2633 times |
Fri 26 September 2025 |
22.22 (-0.45%) |
22.16 |
22.14 - 22.36 |
0.6847 times |
Fri 19 September 2025 |
22.32 (0.54%) |
22.22 |
22.13 - 22.35 |
0.5749 times |
Fri 12 September 2025 |
22.20 (-0.36%) |
22.30 |
22.03 - 22.39 |
1.2779 times |
Fri 05 September 2025 |
22.28 (-0.4%) |
22.16 |
22.16 - 22.40 |
1.5233 times |
Fri 29 August 2025 |
22.37 (0%) |
22.00 |
22.00 - 22.37 |
0.0513 times |
Fri 29 August 2025 |
22.37 (0.95%) |
22.09 |
22.00 - 22.47 |
0.4064 times |
Fri 22 August 2025 |
22.16 (-0.45%) |
22.30 |
21.67 - 22.40 |
1.2083 times |

Monthly price and charts PacificGas Strong monthly Stock price targets for PacificGas PCG-A are 22.1 and 23.28 | Monthly Target 1 | 21.2 | | Monthly Target 2 | 21.82 | | Monthly Target 3 | 22.383333333333 | | Monthly Target 4 | 23 | | Monthly Target 5 | 23.56 |
Monthly price and volumes Pacific Gas
| Date |
Closing |
Open |
Range |
Volume |
Thu 23 October 2025 |
22.43 (1.91%) |
21.77 |
21.77 - 22.95 |
1.0881 times |
Tue 30 September 2025 |
22.01 (-1.61%) |
22.16 |
21.60 - 22.40 |
1.2323 times |
Fri 29 August 2025 |
22.37 (1.91%) |
22.13 |
21.67 - 22.47 |
0.7399 times |
Thu 31 July 2025 |
21.95 (0.14%) |
21.88 |
21.74 - 22.90 |
0.8556 times |
Mon 30 June 2025 |
21.92 (3.89%) |
21.30 |
20.95 - 22.14 |
0.7675 times |
Fri 30 May 2025 |
21.10 (-5.13%) |
22.24 |
20.78 - 23.84 |
0.7257 times |
Wed 30 April 2025 |
22.24 (-5.92%) |
23.49 |
21.15 - 23.49 |
0.9113 times |
Mon 31 March 2025 |
23.64 (2.07%) |
22.95 |
22.81 - 23.75 |
0.6332 times |
Fri 28 February 2025 |
23.16 (5.56%) |
22.20 |
21.80 - 23.91 |
0.9109 times |
Fri 31 January 2025 |
21.94 (-9.97%) |
24.37 |
21.94 - 24.49 |
2.1354 times |
Tue 31 December 2024 |
24.37 (1.54%) |
24.99 |
23.43 - 25.04 |
0.8545 times |

DMA SMA EMA moving averages of Pacific Gas PCG-A
DMA (daily moving average) of Pacific Gas PCG-A
| DMA period | DMA value | | 5 day DMA | 22.35 | | 12 day DMA | 22.34 | | 20 day DMA | 22.28 | | 35 day DMA | 22.27 | | 50 day DMA | 22.27 | | 100 day DMA | 22.11 | | 150 day DMA | 22.32 | | 200 day DMA | 22.5 | EMA (exponential moving average) of Pacific Gas PCG-A
| EMA period | EMA current | EMA prev | EMA prev2 | | 5 day EMA | 22.37 | 22.34 | 22.33 | | 12 day EMA | 22.34 | 22.32 | 22.31 | | 20 day EMA | 22.31 | 22.3 | 22.3 | | 35 day EMA | 22.28 | 22.27 | 22.27 | | 50 day EMA | 22.26 | 22.25 | 22.25 |
SMA (simple moving average) of Pacific Gas PCG-A
| SMA period | SMA current | SMA prev | SMA prev2 | | 5 day SMA | 22.35 | 22.31 | 22.31 | | 12 day SMA | 22.34 | 22.33 | 22.32 | | 20 day SMA | 22.28 | 22.28 | 22.28 | | 35 day SMA | 22.27 | 22.27 | 22.27 | | 50 day SMA | 22.27 | 22.26 | 22.26 | | 100 day SMA | 22.11 | 22.11 | 22.11 | | 150 day SMA | 22.32 | 22.33 | 22.33 | | 200 day SMA | 22.5 | 22.51 | 22.52 |
|
|
