CefIncome PCEF full analysis,charts,indicators,moving averages,SMA,DMA,EMA,ADX,MACD,RSICef Income PCEF WideScreen charts, DMA,SMA,EMA technical analysis, forecast prediction, by indicators ADX,MACD,RSI,CCI AMEX stock exchange
Daily price and charts and targets CefIncome Strong Daily Stock price targets for CefIncome PCEF are 19.82 and 19.9 | Daily Target 1 | 19.76 | | Daily Target 2 | 19.8 | | Daily Target 3 | 19.84 | | Daily Target 4 | 19.88 | | Daily Target 5 | 19.92 |
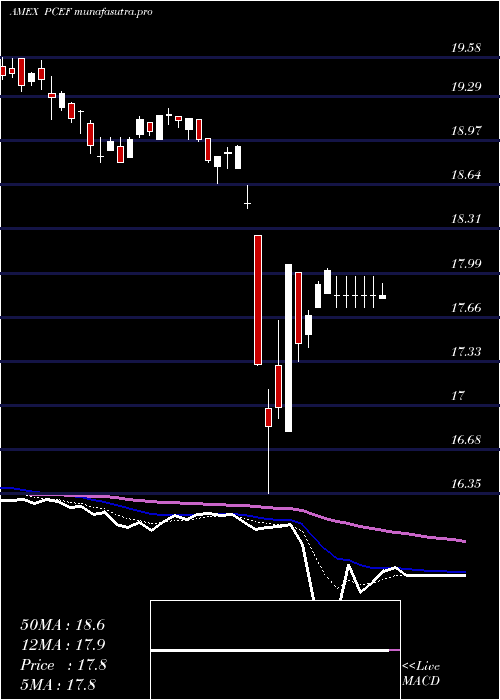
Daily price and volume Cef Income
| Date |
Closing |
Open |
Range |
Volume |
Thu 23 October 2025 |
19.84 (0.3%) |
19.83 |
19.80 - 19.88 |
1.298 times |
Wed 22 October 2025 |
19.78 (-0.05%) |
19.77 |
19.72 - 19.88 |
0.7526 times |
Tue 21 October 2025 |
19.79 (0.25%) |
19.73 |
19.73 - 19.85 |
0.7278 times |
Mon 20 October 2025 |
19.74 (-0.25%) |
20.22 |
19.70 - 20.22 |
1.1874 times |
Fri 17 October 2025 |
19.79 (-0.2%) |
19.81 |
19.75 - 19.89 |
0.6153 times |
Thu 16 October 2025 |
19.83 (-0.65%) |
19.99 |
19.83 - 20.05 |
1.1418 times |
Wed 15 October 2025 |
19.96 (0.35%) |
19.96 |
19.94 - 20.10 |
1.0043 times |
Tue 14 October 2025 |
19.89 (-0.3%) |
19.85 |
19.83 - 19.98 |
0.6267 times |
Mon 13 October 2025 |
19.95 (0.71%) |
20.00 |
19.91 - 20.00 |
1.1134 times |
Fri 10 October 2025 |
19.81 (-1.69%) |
20.13 |
19.76 - 20.15 |
1.5326 times |
Thu 09 October 2025 |
20.15 (-0.25%) |
20.23 |
20.12 - 20.23 |
0.6834 times |
Weekly price and charts CefIncome Strong weekly Stock price targets for CefIncome PCEF are 19.51 and 20.03 | Weekly Target 1 | 19.4 | | Weekly Target 2 | 19.62 | | Weekly Target 3 | 19.92 | | Weekly Target 4 | 20.14 | | Weekly Target 5 | 20.44 |
Weekly price and volumes for Cef Income
| Date |
Closing |
Open |
Range |
Volume |
Thu 23 October 2025 |
19.84 (0.25%) |
20.22 |
19.70 - 20.22 |
0.7637 times |
Fri 17 October 2025 |
19.79 (-0.1%) |
20.00 |
19.75 - 20.10 |
0.8669 times |
Fri 10 October 2025 |
19.81 (-1%) |
20.10 |
19.76 - 20.23 |
2.9389 times |
Fri 03 October 2025 |
20.01 (0.65%) |
19.89 |
19.88 - 20.12 |
0.973 times |
Fri 26 September 2025 |
19.88 (-1.54%) |
20.08 |
19.87 - 20.18 |
1.4925 times |
Fri 19 September 2025 |
20.19 (0.1%) |
20.20 |
20.11 - 20.25 |
0.8563 times |
Fri 12 September 2025 |
20.17 (1%) |
19.98 |
19.98 - 20.17 |
0.5975 times |
Fri 05 September 2025 |
19.97 (0%) |
19.83 |
19.81 - 20.03 |
0.5714 times |
Fri 29 August 2025 |
19.97 (0%) |
19.99 |
19.92 - 19.99 |
0.1516 times |
Fri 29 August 2025 |
19.97 (0.86%) |
19.71 |
19.71 - 19.99 |
0.7883 times |
Fri 22 August 2025 |
19.80 (-0.5%) |
19.78 |
19.57 - 19.80 |
0.8609 times |

Monthly price and charts CefIncome Strong monthly Stock price targets for CefIncome PCEF are 19.51 and 20.04 | Monthly Target 1 | 19.39 | | Monthly Target 2 | 19.62 | | Monthly Target 3 | 19.923333333333 | | Monthly Target 4 | 20.15 | | Monthly Target 5 | 20.45 |
Monthly price and volumes Cef Income
| Date |
Closing |
Open |
Range |
Volume |
Thu 23 October 2025 |
19.84 (-0.65%) |
19.98 |
19.70 - 20.23 |
1.0537 times |
Tue 30 September 2025 |
19.97 (0%) |
19.83 |
19.81 - 20.25 |
0.7521 times |
Fri 29 August 2025 |
19.97 (1.63%) |
19.56 |
19.44 - 19.99 |
0.703 times |
Thu 31 July 2025 |
19.65 (0.56%) |
19.57 |
19.50 - 19.79 |
0.6823 times |
Mon 30 June 2025 |
19.54 (2.52%) |
18.97 |
18.96 - 19.58 |
0.8412 times |
Fri 30 May 2025 |
19.06 (3.36%) |
18.54 |
18.51 - 19.10 |
0.7502 times |
Wed 30 April 2025 |
18.44 (-2.18%) |
18.87 |
16.35 - 18.93 |
1.5569 times |
Mon 31 March 2025 |
18.85 (-3.13%) |
19.50 |
18.65 - 19.56 |
1.764 times |
Fri 28 February 2025 |
19.46 (-1.07%) |
19.55 |
19.33 - 19.95 |
0.8593 times |
Fri 31 January 2025 |
19.67 (2.66%) |
19.17 |
19.10 - 19.78 |
1.0372 times |
Tue 31 December 2024 |
19.16 (-1.99%) |
19.83 |
19.02 - 19.90 |
0.6718 times |

DMA SMA EMA moving averages of Cef Income PCEF
DMA (daily moving average) of Cef Income PCEF
| DMA period | DMA value | | 5 day DMA | 19.79 | | 12 day DMA | 19.89 | | 20 day DMA | 19.94 | | 35 day DMA | 20.01 | | 50 day DMA | 19.96 | | 100 day DMA | 19.74 | | 150 day DMA | 19.3 | | 200 day DMA | 19.34 | EMA (exponential moving average) of Cef Income PCEF
| EMA period | EMA current | EMA prev | EMA prev2 | | 5 day EMA | 19.82 | 19.81 | 19.82 | | 12 day EMA | 19.87 | 19.87 | 19.89 | | 20 day EMA | 19.91 | 19.92 | 19.93 | | 35 day EMA | 19.93 | 19.94 | 19.95 | | 50 day EMA | 19.93 | 19.93 | 19.94 |
SMA (simple moving average) of Cef Income PCEF
| SMA period | SMA current | SMA prev | SMA prev2 | | 5 day SMA | 19.79 | 19.79 | 19.82 | | 12 day SMA | 19.89 | 19.92 | 19.94 | | 20 day SMA | 19.94 | 19.94 | 19.95 | | 35 day SMA | 20.01 | 20.01 | 20.02 | | 50 day SMA | 19.96 | 19.97 | 19.97 | | 100 day SMA | 19.74 | 19.73 | 19.73 | | 150 day SMA | 19.3 | 19.29 | 19.29 | | 200 day SMA | 19.34 | 19.34 | 19.34 |
|
|
