PacerLunt PAMC full analysis,charts,indicators,moving averages,SMA,DMA,EMA,ADX,MACD,RSIPacer Lunt PAMC WideScreen charts, DMA,SMA,EMA technical analysis, forecast prediction, by indicators ADX,MACD,RSI,CCI AMEX stock exchange
Daily price and charts and targets PacerLunt Strong Daily Stock price targets for PacerLunt PAMC are 46.68 and 46.99 | Daily Target 1 | 46.43 | | Daily Target 2 | 46.61 | | Daily Target 3 | 46.74 | | Daily Target 4 | 46.92 | | Daily Target 5 | 47.05 |
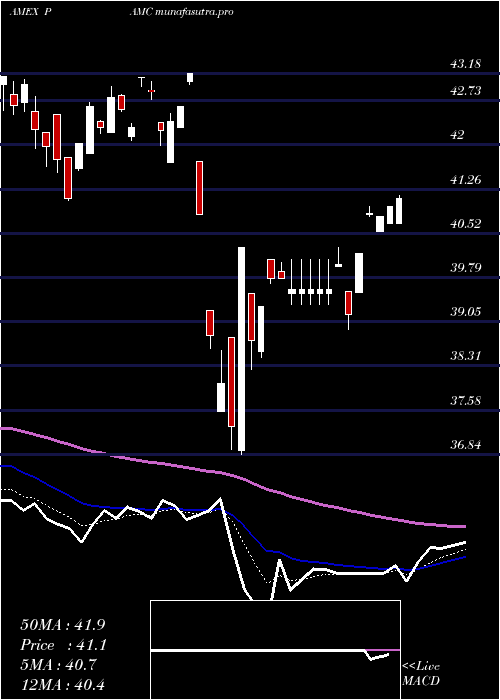
Daily price and volume Pacer Lunt
| Date |
Closing |
Open |
Range |
Volume |
Thu 23 October 2025 |
46.79 (0.43%) |
46.73 |
46.56 - 46.87 |
0.7817 times |
Wed 22 October 2025 |
46.59 (-0.68%) |
46.70 |
46.48 - 46.76 |
1.1167 times |
Tue 21 October 2025 |
46.91 (0.21%) |
47.01 |
46.91 - 47.01 |
0.307 times |
Mon 20 October 2025 |
46.81 (0.84%) |
46.72 |
46.60 - 46.83 |
0.6439 times |
Fri 17 October 2025 |
46.42 (0.19%) |
46.46 |
46.21 - 46.46 |
1.228 times |
Thu 16 October 2025 |
46.33 (-0.86%) |
46.76 |
46.25 - 46.78 |
1.3047 times |
Wed 15 October 2025 |
46.73 (0.24%) |
46.98 |
46.62 - 46.98 |
1.7269 times |
Tue 07 October 2025 |
46.62 (-0.43%) |
46.85 |
46.54 - 46.85 |
1.2664 times |
Mon 06 October 2025 |
46.82 (-0.3%) |
46.83 |
46.82 - 47.05 |
0.8381 times |
Fri 03 October 2025 |
46.96 (0.04%) |
47.03 |
46.96 - 47.26 |
0.7867 times |
Thu 02 October 2025 |
46.94 (-0.38%) |
46.77 |
46.71 - 46.97 |
3.5535 times |
Weekly price and charts PacerLunt Strong weekly Stock price targets for PacerLunt PAMC are 46.64 and 47.17 | Weekly Target 1 | 46.23 | | Weekly Target 2 | 46.51 | | Weekly Target 3 | 46.76 | | Weekly Target 4 | 47.04 | | Weekly Target 5 | 47.29 |
Weekly price and volumes for Pacer Lunt
| Date |
Closing |
Open |
Range |
Volume |
Thu 23 October 2025 |
46.79 (0.8%) |
46.72 |
46.48 - 47.01 |
0.3245 times |
Fri 17 October 2025 |
46.42 (-1.15%) |
46.83 |
46.21 - 47.05 |
0.7248 times |
Fri 03 October 2025 |
46.96 (-0.32%) |
46.77 |
46.71 - 47.26 |
1.3508 times |
Fri 26 September 2025 |
47.11 (0.51%) |
46.69 |
46.55 - 47.13 |
0.8391 times |
Fri 19 September 2025 |
46.87 (-1.01%) |
47.46 |
46.75 - 47.46 |
1.3548 times |
Fri 12 September 2025 |
47.35 (-0.21%) |
47.14 |
46.94 - 47.68 |
1.1975 times |
Fri 05 September 2025 |
47.45 (0.66%) |
46.49 |
46.47 - 47.50 |
1.0358 times |
Fri 29 August 2025 |
47.14 (0%) |
47.32 |
46.96 - 47.35 |
0.2185 times |
Fri 29 August 2025 |
47.14 (0.66%) |
46.63 |
46.53 - 47.35 |
2.0103 times |
Fri 22 August 2025 |
46.83 (3.97%) |
44.97 |
44.76 - 46.83 |
0.944 times |
Fri 15 August 2025 |
45.04 (3.56%) |
43.67 |
43.28 - 45.83 |
1.7831 times |
Monthly price and charts PacerLunt Strong monthly Stock price targets for PacerLunt PAMC are 45.98 and 47.03 | Monthly Target 1 | 45.7 | | Monthly Target 2 | 46.25 | | Monthly Target 3 | 46.753333333333 | | Monthly Target 4 | 47.3 | | Monthly Target 5 | 47.8 |
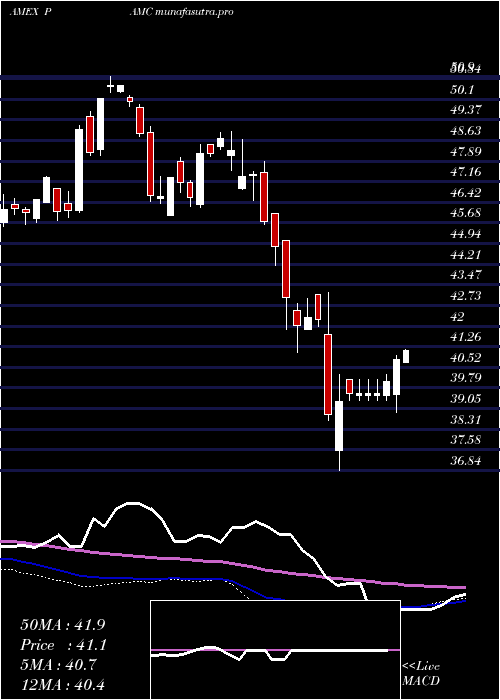
Monthly price and volumes Pacer Lunt
| Date |
Closing |
Open |
Range |
Volume |
Thu 23 October 2025 |
46.79 (-0.49%) |
47.02 |
46.21 - 47.26 |
0.2794 times |
Tue 30 September 2025 |
47.02 (-0.25%) |
46.49 |
46.47 - 47.68 |
0.5662 times |
Fri 29 August 2025 |
47.14 (7.19%) |
43.02 |
42.66 - 47.35 |
0.9062 times |
Thu 31 July 2025 |
43.98 (0.37%) |
43.71 |
43.62 - 45.01 |
1.2483 times |
Mon 30 June 2025 |
43.82 (1.62%) |
42.66 |
42.36 - 44.03 |
1.2796 times |
Fri 30 May 2025 |
43.12 (5.43%) |
41.00 |
41.00 - 43.72 |
0.9557 times |
Wed 30 April 2025 |
40.90 (-3.51%) |
42.29 |
36.84 - 43.18 |
1.2516 times |
Mon 31 March 2025 |
42.39 (-5.46%) |
45.04 |
41.06 - 45.04 |
0.9405 times |
Fri 28 February 2025 |
44.84 (-7.09%) |
46.92 |
44.18 - 48.65 |
1.559 times |
Fri 31 January 2025 |
48.26 (4.01%) |
46.96 |
46.22 - 48.94 |
1.0134 times |
Tue 31 December 2024 |
46.40 (-8.32%) |
50.16 |
45.93 - 50.24 |
0.5612 times |

DMA SMA EMA moving averages of Pacer Lunt PAMC
DMA (daily moving average) of Pacer Lunt PAMC
| DMA period | DMA value | | 5 day DMA | 46.7 | | 12 day DMA | 46.75 | | 20 day DMA | 46.8 | | 35 day DMA | 46.97 | | 50 day DMA | 46.54 | | 100 day DMA | 45.11 | | 150 day DMA | 43.85 | | 200 day DMA | 44.49 | EMA (exponential moving average) of Pacer Lunt PAMC
| EMA period | EMA current | EMA prev | EMA prev2 | | 5 day EMA | 46.72 | 46.69 | 46.74 | | 12 day EMA | 46.75 | 46.74 | 46.77 | | 20 day EMA | 46.74 | 46.74 | 46.76 | | 35 day EMA | 46.52 | 46.5 | 46.49 | | 50 day EMA | 46.32 | 46.3 | 46.29 |
SMA (simple moving average) of Pacer Lunt PAMC
| SMA period | SMA current | SMA prev | SMA prev2 | | 5 day SMA | 46.7 | 46.61 | 46.64 | | 12 day SMA | 46.75 | 46.77 | 46.8 | | 20 day SMA | 46.8 | 46.82 | 46.84 | | 35 day SMA | 46.97 | 46.98 | 47 | | 50 day SMA | 46.54 | 46.47 | 46.41 | | 100 day SMA | 45.11 | 45.07 | 45.03 | | 150 day SMA | 43.85 | 43.81 | 43.78 | | 200 day SMA | 44.49 | 44.48 | 44.48 |
|
|
