PhysicalPalladium PALL full analysis,charts,indicators,moving averages,SMA,DMA,EMA,ADX,MACD,RSIPhysical Palladium PALL WideScreen charts, DMA,SMA,EMA technical analysis, forecast prediction, by indicators ADX,MACD,RSI,CCI AMEX stock exchange
Daily price and charts and targets PhysicalPalladium Strong Daily Stock price targets for PhysicalPalladium PALL are 128.52 and 134.91 | Daily Target 1 | 123.75 | | Daily Target 2 | 126.89 | | Daily Target 3 | 130.14 | | Daily Target 4 | 133.28 | | Daily Target 5 | 136.53 |
Daily price and volume Physical Palladium
| Date |
Closing |
Open |
Range |
Volume |
Fri 24 October 2025 |
130.03 (-1.35%) |
129.50 |
127.00 - 133.39 |
0.2251 times |
Thu 23 October 2025 |
131.81 (-0.66%) |
132.00 |
130.51 - 134.60 |
0.3981 times |
Wed 22 October 2025 |
132.68 (3.3%) |
130.02 |
127.48 - 134.79 |
1.1815 times |
Tue 21 October 2025 |
128.44 (-6.64%) |
129.46 |
126.13 - 130.30 |
1.2914 times |
Mon 20 October 2025 |
137.58 (3.74%) |
132.46 |
131.01 - 138.00 |
0.7275 times |
Fri 17 October 2025 |
132.62 (-10.16%) |
143.59 |
132.50 - 148.32 |
1.873 times |
Thu 16 October 2025 |
147.62 (4.8%) |
141.20 |
138.74 - 149.00 |
1.3832 times |
Wed 15 October 2025 |
140.86 (1.78%) |
141.26 |
138.20 - 141.67 |
0.9906 times |
Tue 14 October 2025 |
138.39 (2.59%) |
134.63 |
132.50 - 140.58 |
0.9462 times |
Mon 13 October 2025 |
134.89 (4.14%) |
132.62 |
131.95 - 136.58 |
0.9834 times |
Fri 10 October 2025 |
129.53 (0.08%) |
133.09 |
128.07 - 134.59 |
1.2068 times |
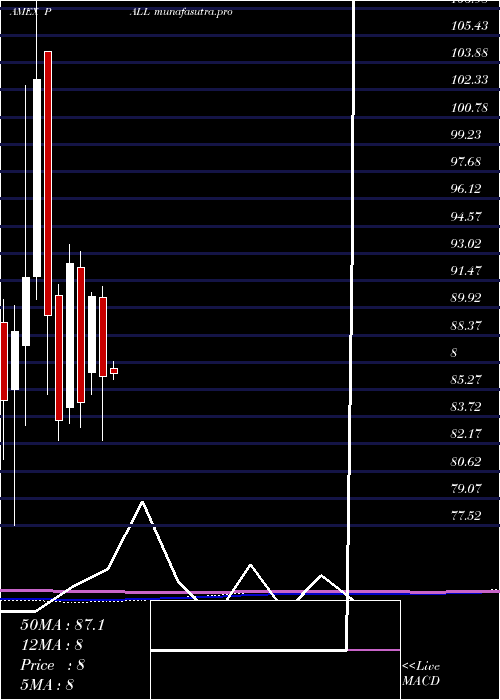
Weekly price and charts PhysicalPalladium Strong weekly Stock price targets for PhysicalPalladium PALL are 122.15 and 134.02 | Weekly Target 1 | 119.52 | | Weekly Target 2 | 124.77 | | Weekly Target 3 | 131.38666666667 | | Weekly Target 4 | 136.64 | | Weekly Target 5 | 143.26 |
Weekly price and volumes for Physical Palladium
| Date |
Closing |
Open |
Range |
Volume |
Fri 24 October 2025 |
130.03 (-1.95%) |
132.46 |
126.13 - 138.00 |
1.1346 times |
Fri 17 October 2025 |
132.62 (2.39%) |
132.62 |
131.95 - 149.00 |
1.8327 times |
Fri 10 October 2025 |
129.53 (11.97%) |
116.00 |
115.14 - 136.66 |
2.3513 times |
Fri 03 October 2025 |
115.68 (-0.2%) |
115.74 |
110.34 - 116.69 |
0.9754 times |
Fri 26 September 2025 |
115.91 (10.55%) |
107.19 |
106.75 - 116.98 |
1.0869 times |
Fri 19 September 2025 |
104.85 (-5.25%) |
108.18 |
103.85 - 109.43 |
0.5673 times |
Fri 12 September 2025 |
110.66 (8.82%) |
103.32 |
102.01 - 112.17 |
0.8759 times |
Fri 05 September 2025 |
101.69 (0.51%) |
101.86 |
100.55 - 106.00 |
0.6689 times |
Fri 29 August 2025 |
101.17 (0%) |
99.69 |
99.37 - 101.25 |
0.0901 times |
Fri 29 August 2025 |
101.17 (-1.5%) |
100.83 |
98.48 - 101.25 |
0.4168 times |
Fri 22 August 2025 |
102.71 (0.77%) |
102.32 |
100.16 - 103.80 |
0.3542 times |
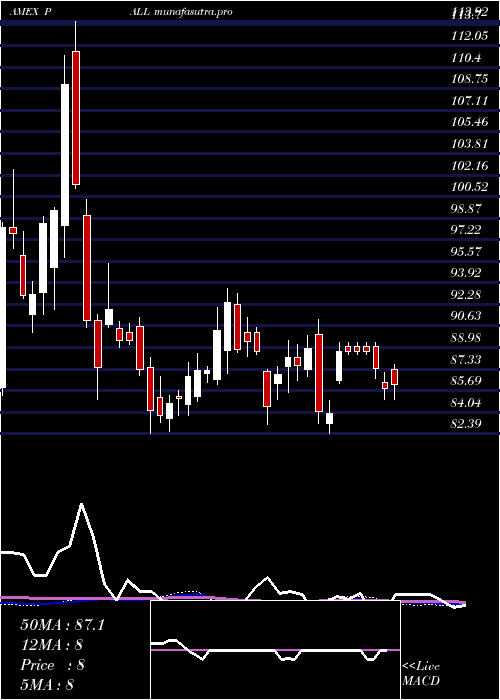
Monthly price and charts PhysicalPalladium Strong monthly Stock price targets for PhysicalPalladium PALL are 120.19 and 158.85 | Monthly Target 1 | 91.13 | | Monthly Target 2 | 110.58 | | Monthly Target 3 | 129.79 | | Monthly Target 4 | 149.24 | | Monthly Target 5 | 168.45 |
Monthly price and volumes Physical Palladium
| Date |
Closing |
Open |
Range |
Volume |
Fri 24 October 2025 |
130.03 (13.89%) |
113.51 |
110.34 - 149.00 |
2.5119 times |
Tue 30 September 2025 |
114.17 (12.85%) |
101.86 |
100.55 - 116.98 |
1.526 times |
Fri 29 August 2025 |
101.17 (-6.89%) |
111.16 |
98.48 - 111.35 |
0.8247 times |
Thu 31 July 2025 |
108.66 (8%) |
101.72 |
99.55 - 119.30 |
1.4761 times |
Mon 30 June 2025 |
100.61 (13.33%) |
90.05 |
89.16 - 104.73 |
1.1132 times |
Fri 30 May 2025 |
88.78 (3.23%) |
86.45 |
85.80 - 95.34 |
0.6579 times |
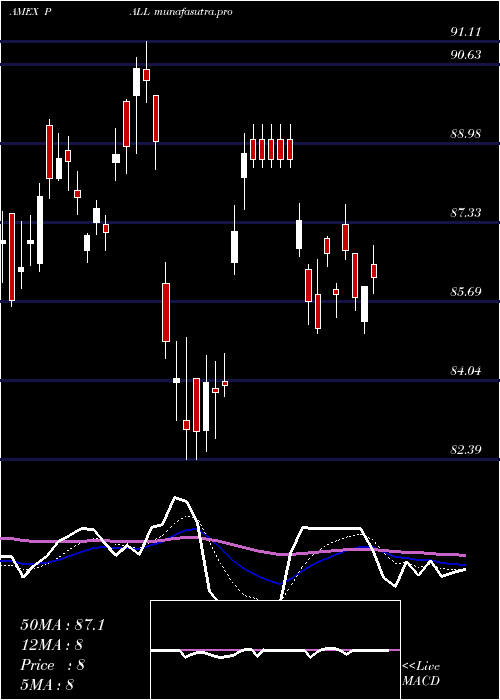
Wed 30 April 2025 |
86.00 (-5.02%) |
90.52 |
82.39 - 91.11 |
0.4844 times |
Mon 31 March 2025 |
90.55 (7.16%) |
86.22 |
85.00 - 90.77 |
0.489 times |
Fri 28 February 2025 |
84.50 (-8.58%) |
92.24 |
83.10 - 93.14 |
0.4642 times |
Fri 31 January 2025 |
92.43 (10.67%) |
84.24 |
83.34 - 93.50 |
0.4527 times |
Tue 31 December 2024 |
83.52 (-6.68%) |
90.60 |
82.39 - 91.27 |
0.3954 times |
DMA SMA EMA moving averages of Physical Palladium PALL
DMA (daily moving average) of Physical Palladium PALL
| DMA period | DMA value | | 5 day DMA | 132.11 | | 12 day DMA | 134.49 | | 20 day DMA | 128.29 | | 35 day DMA | 119.84 | | 50 day DMA | 114.4 | | 100 day DMA | 109.25 | | 150 day DMA | 102.07 | | 200 day DMA | 98.59 | EMA (exponential moving average) of Physical Palladium PALL
| EMA period | EMA current | EMA prev | EMA prev2 | | 5 day EMA | 132.1 | 133.13 | 133.79 | | 12 day EMA | 131.57 | 131.85 | 131.86 | | 20 day EMA | 128.27 | 128.08 | 127.69 | | 35 day EMA | 122.25 | 121.79 | 121.2 | | 50 day EMA | 115.25 | 114.65 | 113.95 |
SMA (simple moving average) of Physical Palladium PALL
| SMA period | SMA current | SMA prev | SMA prev2 | | 5 day SMA | 132.11 | 132.63 | 135.79 | | 12 day SMA | 134.49 | 134.84 | 134.11 | | 20 day SMA | 128.29 | 127.59 | 126.75 | | 35 day SMA | 119.84 | 119.03 | 118.19 | | 50 day SMA | 114.4 | 113.84 | 113.3 | | 100 day SMA | 109.25 | 108.85 | 108.42 | | 150 day SMA | 102.07 | 101.79 | 101.49 | | 200 day SMA | 98.59 | 98.36 | 98.13 |
|
|
