Russell1000 ONEY full analysis,charts,indicators,moving averages,SMA,DMA,EMA,ADX,MACD,RSIRussell 1000 ONEY WideScreen charts, DMA,SMA,EMA technical analysis, forecast prediction, by indicators ADX,MACD,RSI,CCI AMEX stock exchange
Daily price and charts and targets Russell1000 Strong Daily Stock price targets for Russell1000 ONEY are 113.6 and 114.1 | Daily Target 1 | 113.52 | | Daily Target 2 | 113.68 | | Daily Target 3 | 114.01666666667 | | Daily Target 4 | 114.18 | | Daily Target 5 | 114.52 |
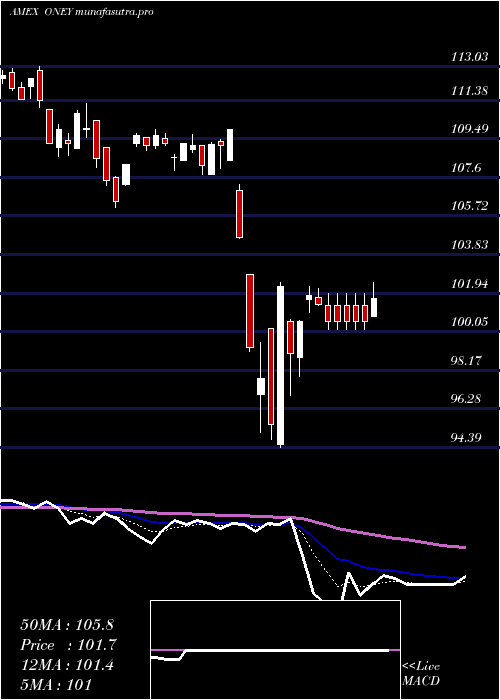
Daily price and volume Russell 1000
| Date |
Closing |
Open |
Range |
Volume |
Fri 24 October 2025 |
113.85 (0.1%) |
114.35 |
113.85 - 114.35 |
0.2384 times |
Thu 23 October 2025 |
113.74 (0.43%) |
113.53 |
113.29 - 113.95 |
0.5464 times |
Wed 22 October 2025 |
113.25 (-0.08%) |
113.07 |
113.07 - 113.55 |
0.6945 times |
Tue 21 October 2025 |
113.34 (0.48%) |
112.80 |
112.80 - 113.56 |
0.8195 times |
Mon 20 October 2025 |
112.80 (0.8%) |
112.40 |
112.40 - 112.88 |
0.4858 times |
Fri 17 October 2025 |
111.90 (0.59%) |
111.11 |
111.11 - 111.97 |
0.4959 times |
Thu 16 October 2025 |
111.24 (-0.88%) |
112.57 |
110.94 - 112.57 |
5.3084 times |
Wed 15 October 2025 |
112.23 (0.17%) |
112.69 |
111.94 - 113.00 |
0.5202 times |
Tue 14 October 2025 |
112.04 (1.12%) |
109.90 |
109.90 - 112.32 |
0.3563 times |
Mon 13 October 2025 |
110.80 (1.16%) |
110.35 |
110.18 - 111.05 |
0.5345 times |
Fri 10 October 2025 |
109.53 (-2.23%) |
112.11 |
109.53 - 112.11 |
1.1545 times |
Weekly price and charts Russell1000 Strong weekly Stock price targets for Russell1000 ONEY are 113.13 and 115.08 | Weekly Target 1 | 111.58 | | Weekly Target 2 | 112.72 | | Weekly Target 3 | 113.53333333333 | | Weekly Target 4 | 114.67 | | Weekly Target 5 | 115.48 |
Weekly price and volumes for Russell 1000
| Date |
Closing |
Open |
Range |
Volume |
Fri 24 October 2025 |
113.85 (1.74%) |
112.40 |
112.40 - 114.35 |
0.2941 times |
Fri 17 October 2025 |
111.90 (2.16%) |
110.35 |
109.90 - 113.00 |
0.7619 times |
Fri 10 October 2025 |
109.53 (-3.95%) |
114.42 |
109.53 - 114.42 |
5.4665 times |
Fri 03 October 2025 |
114.04 (0.72%) |
113.49 |
112.27 - 114.53 |
0.9098 times |
Fri 26 September 2025 |
113.22 (-0.36%) |
112.42 |
111.71 - 113.49 |
0.377 times |
Fri 19 September 2025 |
113.63 (-1.04%) |
114.95 |
113.54 - 114.95 |
0.3243 times |
Fri 12 September 2025 |
114.82 (-0.38%) |
115.29 |
113.60 - 115.60 |
0.3627 times |
Fri 05 September 2025 |
115.26 (0.04%) |
114.37 |
113.69 - 115.72 |
1.1077 times |
Fri 29 August 2025 |
115.21 (0%) |
115.08 |
114.96 - 115.25 |
0.0685 times |
Fri 29 August 2025 |
115.21 (-0.19%) |
115.03 |
114.31 - 115.47 |
0.3274 times |
Fri 22 August 2025 |
115.43 (2.64%) |
112.39 |
112.10 - 115.70 |
0.4959 times |

Monthly price and charts Russell1000 Strong monthly Stock price targets for Russell1000 ONEY are 111.69 and 116.69 | Monthly Target 1 | 107.64 | | Monthly Target 2 | 110.74 | | Monthly Target 3 | 112.63666666667 | | Monthly Target 4 | 115.74 | | Monthly Target 5 | 117.64 |
Monthly price and volumes Russell 1000
| Date |
Closing |
Open |
Range |
Volume |
Fri 24 October 2025 |
113.85 (0.61%) |
112.93 |
109.53 - 114.53 |
1.7022 times |
Tue 30 September 2025 |
113.16 (-1.78%) |
114.37 |
111.71 - 115.72 |
0.5466 times |
Fri 29 August 2025 |
115.21 (4.78%) |
108.32 |
108.15 - 115.70 |
0.573 times |
Thu 31 July 2025 |
109.95 (1.55%) |
108.02 |
108.02 - 113.52 |
0.898 times |
Mon 30 June 2025 |
108.27 (0.85%) |
107.22 |
106.01 - 109.13 |
0.6664 times |
Fri 30 May 2025 |
107.36 (3.09%) |
104.42 |
104.08 - 109.60 |
0.8255 times |
Wed 30 April 2025 |
104.14 (-4.67%) |
109.38 |
94.39 - 109.98 |
1.9853 times |
Mon 31 March 2025 |
109.24 (-2.86%) |
112.83 |
106.14 - 113.03 |
1.0873 times |
Fri 28 February 2025 |
112.46 (0.7%) |
110.32 |
109.77 - 113.24 |
0.7228 times |
Fri 31 January 2025 |
111.68 (2.59%) |
109.72 |
107.36 - 113.12 |
0.9929 times |
Tue 31 December 2024 |
108.86 (-7.08%) |
115.33 |
107.72 - 115.61 |
2.0651 times |

DMA SMA EMA moving averages of Russell 1000 ONEY
DMA (daily moving average) of Russell 1000 ONEY
| DMA period | DMA value | | 5 day DMA | 113.4 | | 12 day DMA | 112.23 | | 20 day DMA | 112.72 | | 35 day DMA | 113.18 | | 50 day DMA | 113.53 | | 100 day DMA | 111.79 | | 150 day DMA | 109.41 | | 200 day DMA | 109.77 | EMA (exponential moving average) of Russell 1000 ONEY
| EMA period | EMA current | EMA prev | EMA prev2 | | 5 day EMA | 113.34 | 113.09 | 112.76 | | 12 day EMA | 112.89 | 112.71 | 112.52 | | 20 day EMA | 112.85 | 112.74 | 112.64 | | 35 day EMA | 113.07 | 113.02 | 112.98 | | 50 day EMA | 113.41 | 113.39 | 113.38 |
SMA (simple moving average) of Russell 1000 ONEY
| SMA period | SMA current | SMA prev | SMA prev2 | | 5 day SMA | 113.4 | 113.01 | 112.51 | | 12 day SMA | 112.23 | 112.19 | 112.15 | | 20 day SMA | 112.72 | 112.69 | 112.6 | | 35 day SMA | 113.18 | 113.22 | 113.26 | | 50 day SMA | 113.53 | 113.5 | 113.49 | | 100 day SMA | 111.79 | 111.72 | 111.66 | | 150 day SMA | 109.41 | 109.38 | 109.35 | | 200 day SMA | 109.77 | 109.74 | 109.72 |
|
|
