OppenheimerRussell OMFL full analysis,charts,indicators,moving averages,SMA,DMA,EMA,ADX,MACD,RSIOppenheimer Russell OMFL WideScreen charts, DMA,SMA,EMA technical analysis, forecast prediction, by indicators ADX,MACD,RSI,CCI AMEX stock exchange
Daily price and charts and targets OppenheimerRussell Strong Daily Stock price targets for OppenheimerRussell OMFL are 60.19 and 60.49 | Daily Target 1 | 59.96 | | Daily Target 2 | 60.12 | | Daily Target 3 | 60.256666666667 | | Daily Target 4 | 60.42 | | Daily Target 5 | 60.56 |
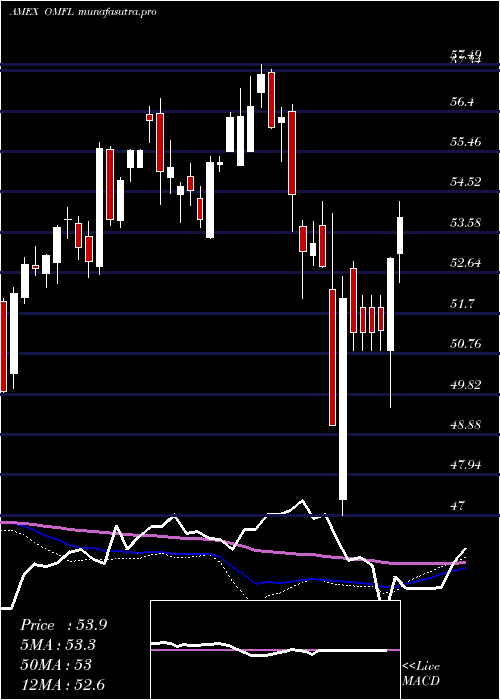
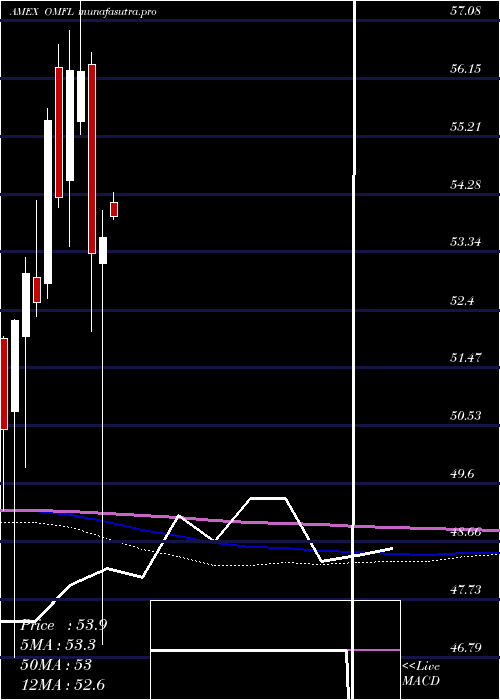
Daily price and volume Oppenheimer Russell
| Date |
Closing |
Open |
Range |
Volume |
Thu 23 October 2025 |
60.29 (0.27%) |
60.17 |
60.09 - 60.39 |
0.7279 times |
Wed 22 October 2025 |
60.13 (-0.43%) |
60.32 |
59.88 - 60.38 |
1.4886 times |
Tue 21 October 2025 |
60.39 (0.15%) |
60.26 |
60.24 - 60.46 |
1.1218 times |
Mon 20 October 2025 |
60.30 (0.99%) |
59.92 |
59.92 - 60.39 |
1.1502 times |
Fri 17 October 2025 |
59.71 (0.86%) |
59.16 |
59.16 - 59.82 |
0.9892 times |
Thu 16 October 2025 |
59.20 (-0.99%) |
59.83 |
58.97 - 59.93 |
0.7481 times |
Wed 15 October 2025 |
59.79 (0.03%) |
60.01 |
59.43 - 60.27 |
0.57 times |
Tue 14 October 2025 |
59.77 (0.27%) |
59.17 |
59.07 - 59.96 |
1.2167 times |
Mon 13 October 2025 |
59.61 (0.88%) |
59.57 |
59.37 - 59.73 |
0.7211 times |
Fri 10 October 2025 |
59.09 (-1.96%) |
60.31 |
59.07 - 60.52 |
1.2665 times |
Thu 09 October 2025 |
60.27 (-0.28%) |
60.57 |
60.12 - 60.57 |
0.8535 times |

Weekly price and charts OppenheimerRussell Strong weekly Stock price targets for OppenheimerRussell OMFL are 60.09 and 60.67 | Weekly Target 1 | 59.63 | | Weekly Target 2 | 59.96 | | Weekly Target 3 | 60.21 | | Weekly Target 4 | 60.54 | | Weekly Target 5 | 60.79 |
Weekly price and volumes for Oppenheimer Russell
| Date |
Closing |
Open |
Range |
Volume |
Thu 23 October 2025 |
60.29 (0.97%) |
59.92 |
59.88 - 60.46 |
0.9575 times |
Fri 17 October 2025 |
59.71 (1.05%) |
59.57 |
58.97 - 60.27 |
0.9055 times |
Fri 10 October 2025 |
59.09 (-1.83%) |
60.24 |
59.07 - 60.57 |
1.5208 times |
Fri 03 October 2025 |
60.19 (0.25%) |
60.19 |
59.96 - 60.47 |
0.9777 times |
Fri 26 September 2025 |
60.04 (-0.46%) |
60.04 |
59.49 - 60.50 |
0.9073 times |
Fri 19 September 2025 |
60.32 (0.89%) |
59.96 |
59.68 - 60.36 |
1.5936 times |
Fri 12 September 2025 |
59.79 (0.67%) |
59.48 |
59.21 - 59.96 |
1.4082 times |
Fri 05 September 2025 |
59.39 (0.15%) |
58.69 |
58.50 - 59.85 |
0.6894 times |
Fri 29 August 2025 |
59.30 (0%) |
59.41 |
59.15 - 59.42 |
0.1335 times |
Fri 29 August 2025 |
59.30 (-0.1%) |
59.31 |
58.90 - 59.52 |
0.9066 times |
Fri 22 August 2025 |
59.36 (0.2%) |
59.14 |
58.64 - 59.49 |
0.9339 times |
Monthly price and charts OppenheimerRussell Strong monthly Stock price targets for OppenheimerRussell OMFL are 59.63 and 61.23 | Monthly Target 1 | 58.34 | | Monthly Target 2 | 59.32 | | Monthly Target 3 | 59.943333333333 | | Monthly Target 4 | 60.92 | | Monthly Target 5 | 61.54 |
Monthly price and volumes Oppenheimer Russell
| Date |
Closing |
Open |
Range |
Volume |
Thu 23 October 2025 |
60.29 (0.05%) |
60.01 |
58.97 - 60.57 |
0.5573 times |
Tue 30 September 2025 |
60.26 (1.62%) |
58.69 |
58.50 - 60.50 |
0.6993 times |
Fri 29 August 2025 |
59.30 (1.87%) |
57.72 |
57.23 - 59.60 |
0.6433 times |
Thu 31 July 2025 |
58.21 (0.74%) |
57.64 |
57.13 - 58.82 |
0.8153 times |
Mon 30 June 2025 |
57.78 (2.65%) |
56.08 |
55.50 - 57.90 |
0.8125 times |
Fri 30 May 2025 |
56.29 (5.08%) |
54.15 |
53.81 - 56.59 |
0.8542 times |
Wed 30 April 2025 |
53.57 (0.49%) |
53.15 |
47.00 - 54.02 |
1.6402 times |
Mon 31 March 2025 |
53.31 (-5.24%) |
56.38 |
52.05 - 56.56 |
1.0792 times |
Fri 28 February 2025 |
56.26 (-0.04%) |
55.45 |
55.24 - 57.49 |
1.1011 times |
Fri 31 January 2025 |
56.28 (3.78%) |
54.50 |
53.43 - 56.92 |
1.7975 times |
Tue 31 December 2024 |
54.23 (-2.24%) |
56.33 |
54.07 - 56.70 |
0.8725 times |
DMA SMA EMA moving averages of Oppenheimer Russell OMFL
DMA (daily moving average) of Oppenheimer Russell OMFL
| DMA period | DMA value | | 5 day DMA | 60.16 | | 12 day DMA | 59.92 | | 20 day DMA | 60.02 | | 35 day DMA | 59.96 | | 50 day DMA | 59.74 | | 100 day DMA | 58.65 | | 150 day DMA | 56.91 | | 200 day DMA | 56.54 | EMA (exponential moving average) of Oppenheimer Russell OMFL
| EMA period | EMA current | EMA prev | EMA prev2 | | 5 day EMA | 60.14 | 60.06 | 60.03 | | 12 day EMA | 60.03 | 59.98 | 59.95 | | 20 day EMA | 59.97 | 59.94 | 59.92 | | 35 day EMA | 59.85 | 59.82 | 59.8 | | 50 day EMA | 59.73 | 59.71 | 59.69 |
SMA (simple moving average) of Oppenheimer Russell OMFL
| SMA period | SMA current | SMA prev | SMA prev2 | | 5 day SMA | 60.16 | 59.95 | 59.88 | | 12 day SMA | 59.92 | 59.91 | 59.92 | | 20 day SMA | 60.02 | 60 | 59.99 | | 35 day SMA | 59.96 | 59.94 | 59.92 | | 50 day SMA | 59.74 | 59.72 | 59.7 | | 100 day SMA | 58.65 | 58.61 | 58.57 | | 150 day SMA | 56.91 | 56.87 | 56.82 | | 200 day SMA | 56.54 | 56.51 | 56.48 |
|
|
