OilServices OIH full analysis,charts,indicators,moving averages,SMA,DMA,EMA,ADX,MACD,RSIOil Services OIH WideScreen charts, DMA,SMA,EMA technical analysis, forecast prediction, by indicators ADX,MACD,RSI,CCI AMEX stock exchange
Daily price and charts and targets OilServices Strong Daily Stock price targets for OilServices OIH are 273.58 and 279.48 | Daily Target 1 | 272.6 | | Daily Target 2 | 274.56 | | Daily Target 3 | 278.49666666667 | | Daily Target 4 | 280.46 | | Daily Target 5 | 284.4 |
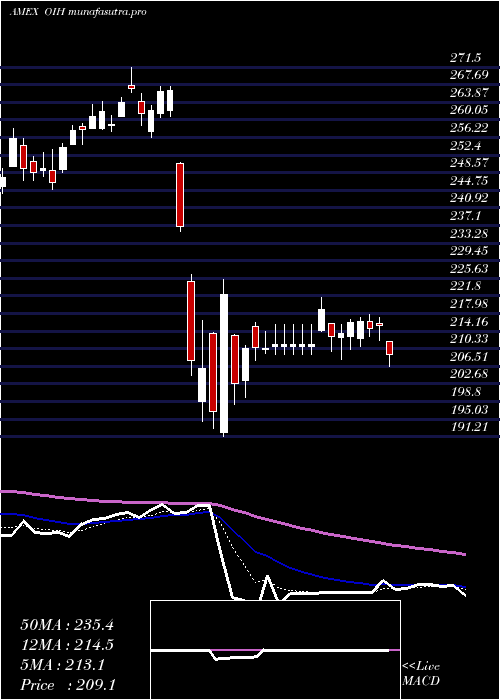
Daily price and volume Oil Services
| Date |
Closing |
Open |
Range |
Volume |
Fri 24 October 2025 |
276.53 (-0.95%) |
279.32 |
276.53 - 282.43 |
0.7584 times |
Thu 23 October 2025 |
279.19 (5.2%) |
268.35 |
268.35 - 280.05 |
1.8445 times |
Wed 22 October 2025 |
265.40 (2.2%) |
262.96 |
261.04 - 267.82 |
1.234 times |
Tue 21 October 2025 |
259.68 (1.18%) |
260.22 |
256.26 - 262.43 |
1.4719 times |
Mon 20 October 2025 |
256.65 (2.02%) |
254.00 |
252.05 - 257.49 |
0.5836 times |
Fri 17 October 2025 |
251.56 (0.77%) |
249.90 |
246.20 - 252.32 |
0.8436 times |
Thu 16 October 2025 |
249.64 (-0.85%) |
252.78 |
246.65 - 253.96 |
0.6744 times |
Wed 15 October 2025 |
251.79 (1.2%) |
251.33 |
248.23 - 255.18 |
1.0615 times |
Tue 14 October 2025 |
248.81 (-0.3%) |
244.52 |
243.99 - 250.19 |
0.5941 times |
Mon 13 October 2025 |
249.56 (2.93%) |
247.46 |
243.16 - 249.70 |
0.934 times |
Fri 10 October 2025 |
242.45 (-5.69%) |
254.14 |
242.24 - 255.83 |
1.7631 times |
Weekly price and charts OilServices Strong weekly Stock price targets for OilServices OIH are 264.29 and 294.67 | Weekly Target 1 | 239.96 | | Weekly Target 2 | 258.24 | | Weekly Target 3 | 270.33666666667 | | Weekly Target 4 | 288.62 | | Weekly Target 5 | 300.72 |
Weekly price and volumes for Oil Services
| Date |
Closing |
Open |
Range |
Volume |
Fri 24 October 2025 |
276.53 (9.93%) |
254.00 |
252.05 - 282.43 |
1.2439 times |
Fri 17 October 2025 |
251.56 (3.76%) |
247.46 |
243.16 - 255.18 |
0.8671 times |
Fri 10 October 2025 |
242.45 (-7.72%) |
262.90 |
242.24 - 267.46 |
1.0693 times |
Fri 03 October 2025 |
262.73 (-1.97%) |
266.99 |
255.06 - 266.99 |
1.0006 times |
Fri 26 September 2025 |
268.01 (5.3%) |
251.98 |
249.96 - 270.28 |
1.8377 times |
Fri 19 September 2025 |
254.52 (-1.2%) |
258.34 |
252.29 - 263.05 |
0.9309 times |
Fri 12 September 2025 |
257.62 (0.98%) |
257.34 |
251.27 - 263.63 |
1.0864 times |
Fri 05 September 2025 |
255.13 (-0.67%) |
255.00 |
247.96 - 258.90 |
0.9662 times |
Fri 29 August 2025 |
256.85 (0%) |
255.99 |
255.82 - 258.56 |
0.1411 times |
Fri 29 August 2025 |
256.85 (1.85%) |
251.54 |
248.38 - 258.56 |
0.8567 times |
Fri 22 August 2025 |
252.19 (6.56%) |
237.00 |
234.39 - 252.99 |
1.0073 times |

Monthly price and charts OilServices Strong monthly Stock price targets for OilServices OIH are 259.39 and 299.58 | Monthly Target 1 | 226.88 | | Monthly Target 2 | 251.7 | | Monthly Target 3 | 267.06666666667 | | Monthly Target 4 | 291.89 | | Monthly Target 5 | 307.26 |
Monthly price and volumes Oil Services
| Date |
Closing |
Open |
Range |
Volume |
Fri 24 October 2025 |
276.53 (6.39%) |
259.44 |
242.24 - 282.43 |
0.5931 times |
Tue 30 September 2025 |
259.91 (1.19%) |
255.00 |
247.96 - 270.28 |
0.9281 times |
Fri 29 August 2025 |
256.85 (5.39%) |
240.62 |
231.83 - 258.56 |
0.7864 times |
Thu 31 July 2025 |
243.72 (5.83%) |
230.36 |
227.68 - 258.18 |
1.1289 times |
Mon 30 June 2025 |
230.29 (6.3%) |
221.70 |
216.68 - 251.32 |
1.0314 times |
Fri 30 May 2025 |
216.64 (3.63%) |
209.86 |
209.02 - 238.22 |
1.1019 times |
Wed 30 April 2025 |
209.06 (-20.24%) |
261.34 |
191.21 - 267.37 |
1.2867 times |
Mon 31 March 2025 |
262.12 (-1.6%) |
268.09 |
241.01 - 271.50 |
1.0087 times |
Fri 28 February 2025 |
266.38 (-3.82%) |
275.94 |
259.49 - 287.85 |
1.0572 times |
Fri 31 January 2025 |
276.96 (2.11%) |
275.99 |
273.67 - 303.77 |
1.0777 times |
Tue 31 December 2024 |
271.23 (-9.69%) |
286.84 |
257.78 - 293.81 |
0.7874 times |

DMA SMA EMA moving averages of Oil Services OIH
DMA (daily moving average) of Oil Services OIH
| DMA period | DMA value | | 5 day DMA | 267.49 | | 12 day DMA | 257.36 | | 20 day DMA | 259.64 | | 35 day DMA | 259.31 | | 50 day DMA | 256.47 | | 100 day DMA | 248.1 | | 150 day DMA | 239.58 | | 200 day DMA | 248.01 | EMA (exponential moving average) of Oil Services OIH
| EMA period | EMA current | EMA prev | EMA prev2 | | 5 day EMA | 269.16 | 265.48 | 258.63 | | 12 day EMA | 262.74 | 260.23 | 256.78 | | 20 day EMA | 260.52 | 258.84 | 256.7 | | 35 day EMA | 257.58 | 256.46 | 255.12 | | 50 day EMA | 256.09 | 255.26 | 254.28 |
SMA (simple moving average) of Oil Services OIH
| SMA period | SMA current | SMA prev | SMA prev2 | | 5 day SMA | 267.49 | 262.5 | 256.59 | | 12 day SMA | 257.36 | 256.23 | 254.96 | | 20 day SMA | 259.64 | 259.21 | 258.42 | | 35 day SMA | 259.31 | 258.7 | 258.09 | | 50 day SMA | 256.47 | 255.67 | 254.88 | | 100 day SMA | 248.1 | 247.54 | 246.91 | | 150 day SMA | 239.58 | 239.47 | 239.35 | | 200 day SMA | 248.01 | 248.03 | 248.03 |
|
|
