OShares OGIG full analysis,charts,indicators,moving averages,SMA,DMA,EMA,ADX,MACD,RSIO Shares OGIG WideScreen charts, DMA,SMA,EMA technical analysis, forecast prediction, by indicators ADX,MACD,RSI,CCI AMEX stock exchange
Daily price and charts and targets OShares Strong Daily Stock price targets for OShares OGIG are 57.69 and 57.92 | Daily Target 1 | 57.65 | | Daily Target 2 | 57.72 | | Daily Target 3 | 57.876666666667 | | Daily Target 4 | 57.95 | | Daily Target 5 | 58.11 |
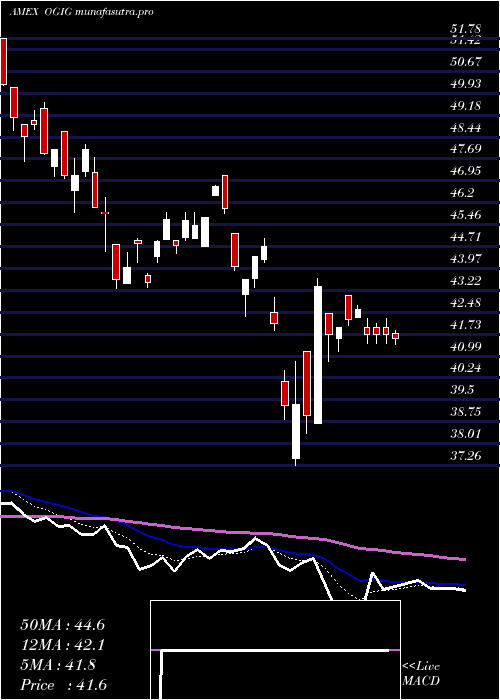
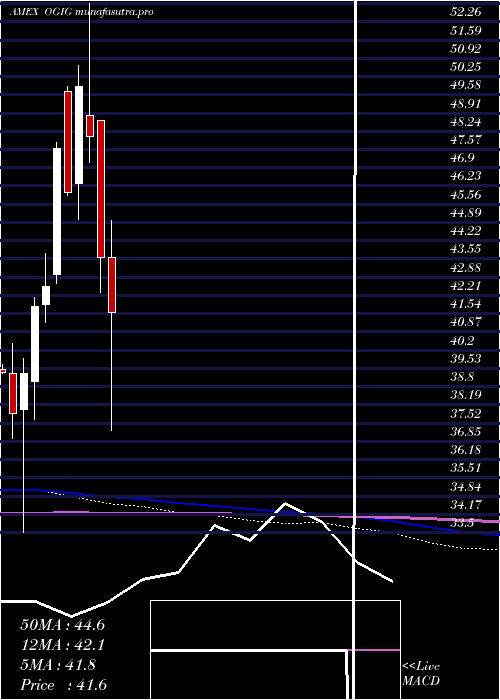
Daily price and volume O Shares
| Date |
Closing |
Open |
Range |
Volume |
Fri 24 October 2025 |
57.80 (0.89%) |
57.90 |
57.80 - 58.03 |
0.6404 times |
Thu 23 October 2025 |
57.29 (1.33%) |
56.99 |
56.99 - 57.31 |
0.3673 times |
Wed 22 October 2025 |
56.54 (-1.19%) |
57.05 |
56.38 - 57.05 |
0.22 times |
Tue 21 October 2025 |
57.22 (0.37%) |
56.94 |
56.76 - 57.25 |
0.4034 times |
Mon 20 October 2025 |
57.01 (1.39%) |
56.53 |
56.53 - 57.04 |
0.7631 times |
Fri 17 October 2025 |
56.23 (-0.21%) |
55.99 |
55.57 - 56.26 |
0.9455 times |
Thu 16 October 2025 |
56.35 (-0.76%) |
57.12 |
56.04 - 57.46 |
2.7575 times |
Wed 15 October 2025 |
56.78 (0.42%) |
56.99 |
56.78 - 57.22 |
1.1496 times |
Tue 14 October 2025 |
56.54 (-0.62%) |
56.02 |
55.75 - 56.88 |
1.2404 times |
Mon 13 October 2025 |
56.89 (1.77%) |
56.74 |
56.54 - 57.01 |
1.5127 times |
Fri 10 October 2025 |
55.90 (-3.32%) |
57.83 |
55.90 - 57.95 |
0.9984 times |
Weekly price and charts OShares Strong weekly Stock price targets for OShares OGIG are 57.09 and 58.74 | Weekly Target 1 | 55.75 | | Weekly Target 2 | 56.78 | | Weekly Target 3 | 57.403333333333 | | Weekly Target 4 | 58.43 | | Weekly Target 5 | 59.05 |
Weekly price and volumes for O Shares
| Date |
Closing |
Open |
Range |
Volume |
Fri 24 October 2025 |
57.80 (2.79%) |
56.53 |
56.38 - 58.03 |
0.6069 times |
Fri 17 October 2025 |
56.23 (0.59%) |
56.74 |
55.57 - 57.46 |
1.9279 times |
Fri 10 October 2025 |
55.90 (-2.55%) |
57.65 |
55.90 - 58.20 |
2.0703 times |
Fri 03 October 2025 |
57.36 (-0.23%) |
57.96 |
57.13 - 58.13 |
0.4588 times |
Fri 26 September 2025 |
57.49 (-1.96%) |
58.45 |
56.76 - 58.66 |
0.8538 times |
Fri 19 September 2025 |
58.64 (3.22%) |
57.04 |
57.04 - 58.75 |
2.0501 times |
Fri 12 September 2025 |
56.81 (2.86%) |
55.61 |
55.61 - 57.10 |
1.1401 times |
Fri 05 September 2025 |
55.23 (1.27%) |
53.77 |
53.51 - 55.34 |
0.3476 times |
Fri 29 August 2025 |
54.54 (0%) |
54.75 |
54.33 - 54.75 |
0.0435 times |
Fri 29 August 2025 |
54.54 (1.19%) |
53.85 |
53.55 - 54.94 |
0.501 times |
Fri 22 August 2025 |
53.90 (-0.35%) |
54.00 |
52.14 - 54.25 |
0.8384 times |

Monthly price and charts OShares Strong monthly Stock price targets for OShares OGIG are 56.69 and 59.32 | Monthly Target 1 | 54.56 | | Monthly Target 2 | 56.18 | | Monthly Target 3 | 57.19 | | Monthly Target 4 | 58.81 | | Monthly Target 5 | 59.82 |
Monthly price and volumes O Shares
| Date |
Closing |
Open |
Range |
Volume |
Fri 24 October 2025 |
57.80 (0.59%) |
57.13 |
55.57 - 58.20 |
0.6722 times |
Tue 30 September 2025 |
57.46 (5.35%) |
53.77 |
53.51 - 58.75 |
0.6343 times |
Fri 29 August 2025 |
54.54 (0.2%) |
53.41 |
52.14 - 55.50 |
0.7396 times |
Thu 31 July 2025 |
54.43 (1.57%) |
53.60 |
52.30 - 55.24 |
0.8171 times |
Mon 30 June 2025 |
53.59 (5.89%) |
50.32 |
50.06 - 53.60 |
0.7996 times |
Fri 30 May 2025 |
50.61 (10.79%) |
46.76 |
46.25 - 50.86 |
1.4382 times |
Wed 30 April 2025 |
45.68 (4.79%) |
43.61 |
37.26 - 45.85 |
1.641 times |
Mon 31 March 2025 |
43.59 (-9.24%) |
48.62 |
42.33 - 48.62 |
0.8013 times |
Fri 28 February 2025 |
48.03 (-3.75%) |
48.83 |
47.10 - 52.94 |
1.3708 times |
Fri 31 January 2025 |
49.90 (8.5%) |
46.31 |
45.01 - 50.67 |
1.0858 times |
Tue 31 December 2024 |
45.99 (-3.4%) |
49.71 |
45.89 - 49.87 |
1.674 times |
DMA SMA EMA moving averages of O Shares OGIG
DMA (daily moving average) of O Shares OGIG
| DMA period | DMA value | | 5 day DMA | 57.17 | | 12 day DMA | 56.86 | | 20 day DMA | 57.15 | | 35 day DMA | 57.27 | | 50 day DMA | 56.32 | | 100 day DMA | 54.73 | | 150 day DMA | 51.77 | | 200 day DMA | 50.89 | EMA (exponential moving average) of O Shares OGIG
| EMA period | EMA current | EMA prev | EMA prev2 | | 5 day EMA | 57.22 | 56.93 | 56.75 | | 12 day EMA | 57.06 | 56.93 | 56.87 | | 20 day EMA | 57.02 | 56.94 | 56.9 | | 35 day EMA | 56.58 | 56.51 | 56.46 | | 50 day EMA | 56.2 | 56.13 | 56.08 |
SMA (simple moving average) of O Shares OGIG
| SMA period | SMA current | SMA prev | SMA prev2 | | 5 day SMA | 57.17 | 56.86 | 56.67 | | 12 day SMA | 56.86 | 56.87 | 56.85 | | 20 day SMA | 57.15 | 57.14 | 57.13 | | 35 day SMA | 57.27 | 57.19 | 57.12 | | 50 day SMA | 56.32 | 56.24 | 56.17 | | 100 day SMA | 54.73 | 54.67 | 54.6 | | 150 day SMA | 51.77 | 51.69 | 51.6 | | 200 day SMA | 50.89 | 50.84 | 50.79 |
|
|
