GoldMiners NUGT full analysis,charts,indicators,moving averages,SMA,DMA,EMA,ADX,MACD,RSIGold Miners NUGT WideScreen charts, DMA,SMA,EMA technical analysis, forecast prediction, by indicators ADX,MACD,RSI,CCI AMEX stock exchange
Daily price and charts and targets GoldMiners Strong Daily Stock price targets for GoldMiners NUGT are 138.14 and 145.16 | Daily Target 1 | 132.83 | | Daily Target 2 | 136.43 | | Daily Target 3 | 139.85 | | Daily Target 4 | 143.45 | | Daily Target 5 | 146.87 |
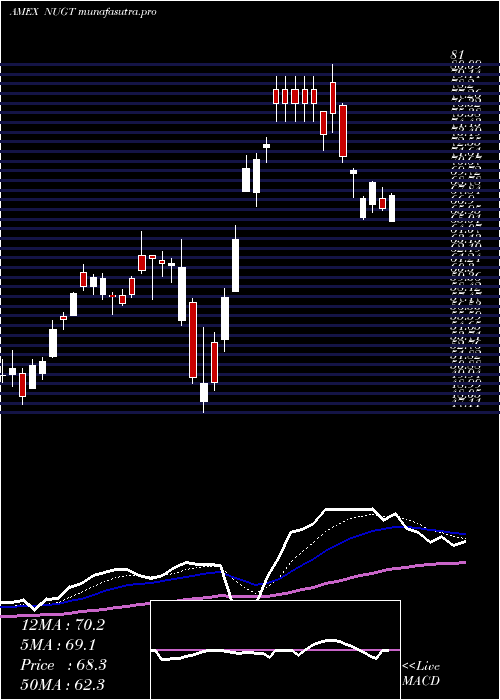
Daily price and volume Gold Miners
| Date |
Closing |
Open |
Range |
Volume |
Thu 23 October 2025 |
140.03 (2.32%) |
138.00 |
136.25 - 143.27 |
0.4796 times |
Wed 22 October 2025 |
136.86 (0.34%) |
138.18 |
124.74 - 139.39 |
1.3337 times |
Tue 21 October 2025 |
136.39 (-18.83%) |
144.00 |
133.70 - 145.52 |
2.304 times |
Mon 20 October 2025 |
168.03 (4.68%) |
162.91 |
160.55 - 170.79 |
0.5596 times |
Fri 17 October 2025 |
160.52 (-14.06%) |
176.85 |
154.66 - 177.77 |
1.6763 times |
Thu 16 October 2025 |
186.78 (7.29%) |
178.33 |
175.28 - 189.68 |
1.1386 times |
Wed 15 October 2025 |
174.09 (7.69%) |
166.02 |
165.00 - 175.34 |
0.7694 times |
Tue 14 October 2025 |
161.66 (-2.25%) |
160.00 |
158.50 - 165.62 |
0.3642 times |
Mon 13 October 2025 |
165.38 (5.45%) |
160.17 |
160.00 - 165.87 |
0.7677 times |
Tue 07 October 2025 |
156.84 (-4%) |
164.18 |
155.67 - 164.18 |
0.6071 times |
Mon 06 October 2025 |
163.37 (3.83%) |
163.04 |
160.01 - 167.11 |
0.6904 times |
Weekly price and charts GoldMiners Strong weekly Stock price targets for GoldMiners NUGT are 109.36 and 155.41 | Weekly Target 1 | 99.14 | | Weekly Target 2 | 119.58 | | Weekly Target 3 | 145.18666666667 | | Weekly Target 4 | 165.63 | | Weekly Target 5 | 191.24 |
Weekly price and volumes for Gold Miners
| Date |
Closing |
Open |
Range |
Volume |
Thu 23 October 2025 |
140.03 (-12.76%) |
162.91 |
124.74 - 170.79 |
1.6685 times |
Fri 17 October 2025 |
160.52 (2.35%) |
160.17 |
154.66 - 189.68 |
1.6825 times |
Tue 07 October 2025 |
156.84 (-0.32%) |
163.04 |
155.67 - 167.11 |
0.4629 times |
Fri 03 October 2025 |
157.35 (6.56%) |
155.49 |
145.20 - 162.37 |
1.0963 times |
Fri 26 September 2025 |
147.67 (6.06%) |
144.80 |
137.65 - 150.40 |
1.2179 times |
Fri 19 September 2025 |
139.23 (7.28%) |
128.79 |
120.47 - 139.87 |
1.0765 times |
Fri 12 September 2025 |
129.78 (10.36%) |
120.95 |
118.26 - 131.16 |
0.8896 times |
Fri 05 September 2025 |
117.60 (9.95%) |
111.00 |
107.18 - 119.65 |
1.0222 times |
Fri 29 August 2025 |
106.96 (0%) |
100.63 |
100.63 - 107.24 |
0.2123 times |
Fri 29 August 2025 |
106.96 (9.8%) |
97.79 |
97.31 - 107.24 |
0.6713 times |
Fri 22 August 2025 |
97.41 (6.38%) |
91.23 |
86.33 - 98.90 |
0.6709 times |

Monthly price and charts GoldMiners Strong monthly Stock price targets for GoldMiners NUGT are 99.92 and 164.86 | Monthly Target 1 | 86.54 | | Monthly Target 2 | 113.29 | | Monthly Target 3 | 151.48333333333 | | Monthly Target 4 | 178.23 | | Monthly Target 5 | 216.42 |
Monthly price and volumes Gold Miners
| Date |
Closing |
Open |
Range |
Volume |
Thu 23 October 2025 |
140.03 (-9.33%) |
158.04 |
124.74 - 189.68 |
0.9555 times |
Tue 30 September 2025 |
154.44 (44.39%) |
111.00 |
107.18 - 157.80 |
1.0036 times |
Fri 29 August 2025 |
106.96 (47.94%) |
75.44 |
73.11 - 107.24 |
0.6577 times |
Thu 31 July 2025 |
72.30 (-2.74%) |
77.12 |
69.37 - 81.67 |
0.8431 times |
Mon 30 June 2025 |
74.34 (3.94%) |
74.56 |
69.64 - 82.80 |
0.7717 times |
Fri 30 May 2025 |
71.52 (4.76%) |
64.37 |
57.10 - 73.21 |
0.9609 times |
Wed 30 April 2025 |
68.27 (9.9%) |
61.90 |
47.11 - 81.00 |
1.321 times |
Mon 31 March 2025 |
62.12 (32.2%) |
48.33 |
46.42 - 64.71 |
0.9895 times |
Fri 28 February 2025 |
46.99 (2.69%) |
46.21 |
44.30 - 54.56 |
1.1615 times |
Fri 31 January 2025 |
45.76 (30.15%) |
36.17 |
36.17 - 47.56 |
1.3355 times |
Tue 31 December 2024 |
35.16 (-17.23%) |
43.82 |
34.08 - 46.46 |
1.088 times |

DMA SMA EMA moving averages of Gold Miners NUGT
DMA (daily moving average) of Gold Miners NUGT
| DMA period | DMA value | | 5 day DMA | 148.37 | | 12 day DMA | 158.94 | | 20 day DMA | 155.15 | | 35 day DMA | 142.29 | | 50 day DMA | 128.39 | | 100 day DMA | 102.59 | | 150 day DMA | 90.3 | | 200 day DMA | 79.51 | EMA (exponential moving average) of Gold Miners NUGT
| EMA period | EMA current | EMA prev | EMA prev2 | | 5 day EMA | 147.15 | 150.71 | 157.64 | | 12 day EMA | 152.96 | 155.31 | 158.66 | | 20 day EMA | 150.56 | 151.67 | 153.23 | | 35 day EMA | 140.22 | 140.23 | 140.43 | | 50 day EMA | 127.08 | 126.55 | 126.13 |
SMA (simple moving average) of Gold Miners NUGT
| SMA period | SMA current | SMA prev | SMA prev2 | | 5 day SMA | 148.37 | 157.72 | 165.16 | | 12 day SMA | 158.94 | 160.38 | 162.1 | | 20 day SMA | 155.15 | 155.47 | 155.59 | | 35 day SMA | 142.29 | 141.34 | 140.49 | | 50 day SMA | 128.39 | 127.39 | 126.47 | | 100 day SMA | 102.59 | 101.88 | 101.22 | | 150 day SMA | 90.3 | 89.76 | 89.22 | | 200 day SMA | 79.51 | 78.99 | 78.5 |
|
|
