Microsectors3x NRGD full analysis,charts,indicators,moving averages,SMA,DMA,EMA,ADX,MACD,RSIMicrosectors 3x NRGD WideScreen charts, DMA,SMA,EMA technical analysis, forecast prediction, by indicators ADX,MACD,RSI,CCI AMEX stock exchange
Daily price and charts and targets Microsectors3x Strong Daily Stock price targets for Microsectors3x NRGD are 16.19 and 16.64 | Daily Target 1 | 15.83 | | Daily Target 2 | 16.09 | | Daily Target 3 | 16.276666666667 | | Daily Target 4 | 16.54 | | Daily Target 5 | 16.73 |
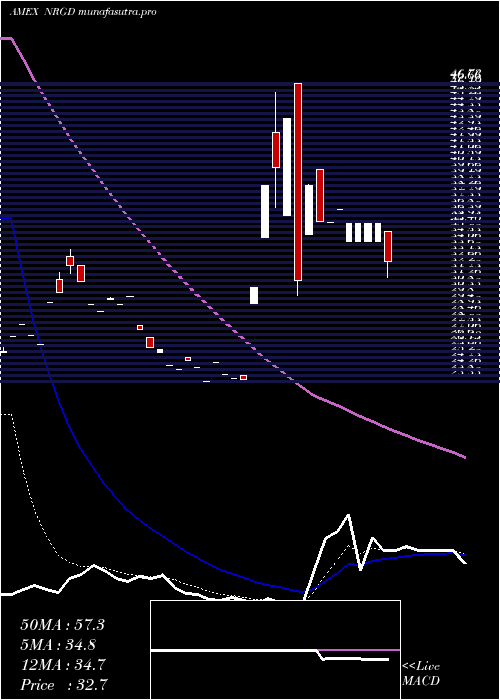
Daily price and volume Microsectors 3x
| Date |
Closing |
Open |
Range |
Volume |
Fri 24 October 2025 |
16.36 (1.68%) |
16.01 |
16.01 - 16.46 |
1.8042 times |
Thu 23 October 2025 |
16.09 (-9.35%) |
17.03 |
15.87 - 17.03 |
3.027 times |
Wed 22 October 2025 |
17.75 (-4.31%) |
17.75 |
17.75 - 17.75 |
0.0572 times |
Tue 21 October 2025 |
18.55 (1.53%) |
18.28 |
18.28 - 18.86 |
0.1907 times |
Mon 20 October 2025 |
18.27 (-2.56%) |
18.49 |
18.27 - 18.63 |
0.267 times |
Fri 17 October 2025 |
18.75 (-0.95%) |
19.02 |
18.75 - 19.02 |
0.4959 times |
Thu 16 October 2025 |
18.93 (4.3%) |
18.17 |
18.17 - 19.24 |
1.2588 times |
Wed 15 October 2025 |
18.15 (1.4%) |
17.61 |
17.45 - 18.35 |
1.7357 times |
Tue 14 October 2025 |
17.90 (0.28%) |
17.60 |
17.60 - 17.90 |
0.3242 times |
Mon 13 October 2025 |
17.85 (10.19%) |
18.10 |
17.85 - 18.20 |
0.8392 times |
Tue 07 October 2025 |
16.20 (0.43%) |
16.98 |
16.20 - 16.98 |
0.6103 times |
Weekly price and charts Microsectors3x Strong weekly Stock price targets for Microsectors3x NRGD are 14.62 and 17.61 | Weekly Target 1 | 14.04 | | Weekly Target 2 | 15.2 | | Weekly Target 3 | 17.03 | | Weekly Target 4 | 18.19 | | Weekly Target 5 | 20.02 |
Weekly price and volumes for Microsectors 3x
| Date |
Closing |
Open |
Range |
Volume |
Fri 24 October 2025 |
16.36 (-12.75%) |
18.49 |
15.87 - 18.86 |
0.9418 times |
Fri 17 October 2025 |
18.75 (15.74%) |
18.10 |
17.45 - 19.24 |
0.8199 times |
Tue 07 October 2025 |
16.20 (-1.64%) |
16.16 |
15.70 - 16.98 |
0.207 times |
Fri 03 October 2025 |
16.47 (14.61%) |
14.66 |
14.66 - 16.74 |
2.0267 times |
Fri 26 September 2025 |
14.37 (-14.97%) |
17.11 |
13.82 - 17.11 |
2.1404 times |
Fri 19 September 2025 |
16.90 (-1.92%) |
17.42 |
15.68 - 17.60 |
0.8736 times |
Fri 12 September 2025 |
17.23 (-1.15%) |
17.19 |
16.49 - 18.13 |
0.8535 times |
Fri 05 September 2025 |
17.43 (9.48%) |
15.75 |
15.57 - 17.65 |
1.2433 times |
Fri 29 August 2025 |
15.92 (0%) |
15.80 |
15.80 - 15.98 |
0.084 times |
Fri 29 August 2025 |
15.92 (-9.39%) |
17.71 |
15.80 - 17.71 |
0.8098 times |
Fri 22 August 2025 |
17.57 (-10.72%) |
20.32 |
17.57 - 20.32 |
0.2117 times |

Monthly price and charts Microsectors3x Strong monthly Stock price targets for Microsectors3x NRGD are 16.03 and 19.57 | Monthly Target 1 | 13.56 | | Monthly Target 2 | 14.96 | | Monthly Target 3 | 17.1 | | Monthly Target 4 | 18.5 | | Monthly Target 5 | 20.64 |
Monthly price and volumes Microsectors 3x
| Date |
Closing |
Open |
Range |
Volume |
Fri 24 October 2025 |
16.36 (3.61%) |
16.07 |
15.70 - 19.24 |
1.1954 times |
Tue 30 September 2025 |
15.79 (-0.82%) |
15.75 |
13.82 - 18.13 |
2.6291 times |
Fri 29 August 2025 |
15.92 (-16.08%) |
19.63 |
15.80 - 21.22 |
0.8764 times |
Thu 31 July 2025 |
18.97 (-16.91%) |
22.73 |
17.61 - 22.93 |
0.772 times |
Mon 30 June 2025 |
22.83 (-15.38%) |
26.26 |
19.05 - 26.62 |
0.7517 times |
Fri 30 May 2025 |
26.98 (-14.46%) |
29.78 |
22.75 - 32.00 |
0.3489 times |
Wed 30 April 2025 |
31.54 (32.02%) |
23.55 |
23.52 - 46.73 |
1.0227 times |
Mon 31 March 2025 |
23.89 (-8.99%) |
29.53 |
23.33 - 33.66 |
0.1797 times |
Fri 28 February 2025 |
26.25 (-84.16%) |
25.00 |
23.88 - 27.78 |
0.031 times |
Wed 24 July 2024 |
165.76 (-1.28%) |
165.36 |
160.04 - 186.72 |
2.193 times |
Fri 28 June 2024 |
167.91 (3.84%) |
165.12 |
164.32 - 193.60 |
3.521 times |

DMA SMA EMA moving averages of Microsectors 3x NRGD
DMA (daily moving average) of Microsectors 3x NRGD
| DMA period | DMA value | | 5 day DMA | 17.4 | | 12 day DMA | 17.58 | | 20 day DMA | 16.78 | | 35 day DMA | 16.78 | | 50 day DMA | 17.11 | | 100 day DMA | 19.08 | | 150 day DMA | 22.57 | | 200 day DMA | 47.25 | EMA (exponential moving average) of Microsectors 3x NRGD
| EMA period | EMA current | EMA prev | EMA prev2 | | 5 day EMA | 17.09 | 17.46 | 18.14 | | 12 day EMA | 17.28 | 17.45 | 17.7 | | 20 day EMA | 17.19 | 17.28 | 17.4 | | 35 day EMA | 17.3 | 17.36 | 17.44 | | 50 day EMA | 17.44 | 17.48 | 17.54 |
SMA (simple moving average) of Microsectors 3x NRGD
| SMA period | SMA current | SMA prev | SMA prev2 | | 5 day SMA | 17.4 | 17.88 | 18.45 | | 12 day SMA | 17.58 | 17.59 | 17.63 | | 20 day SMA | 16.78 | 16.76 | 16.79 | | 35 day SMA | 16.78 | 16.76 | 16.75 | | 50 day SMA | 17.11 | 17.19 | 17.3 | | 100 day SMA | 19.08 | 19.18 | 19.28 | | 150 day SMA | 22.57 | 22.63 | 22.71 | | 200 day SMA | 47.25 | 48.04 | 48.86 |
|
|
