GX NORW full analysis,charts,indicators,moving averages,SMA,DMA,EMA,ADX,MACD,RSIG X NORW WideScreen charts, DMA,SMA,EMA technical analysis, forecast prediction, by indicators ADX,MACD,RSI,CCI AMEX stock exchange
Daily price and charts and targets GX Strong Daily Stock price targets for GX NORW are 29.63 and 30.18 | Daily Target 1 | 29.24 | | Daily Target 2 | 29.47 | | Daily Target 3 | 29.786666666667 | | Daily Target 4 | 30.02 | | Daily Target 5 | 30.34 |
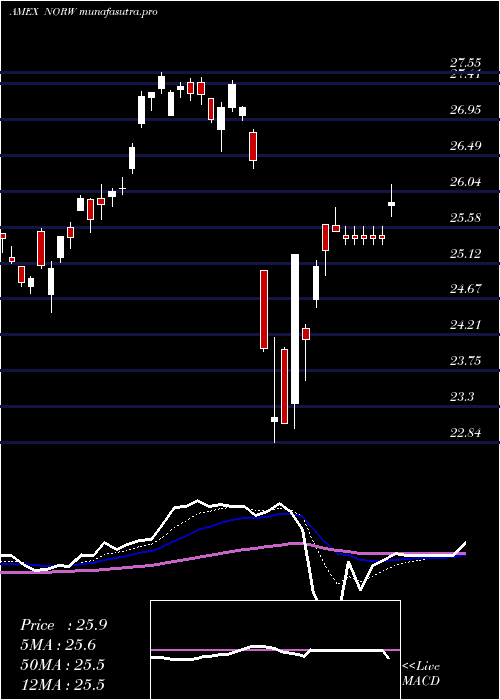
Daily price and volume G X
| Date |
Closing |
Open |
Range |
Volume |
Fri 24 October 2025 |
29.71 (-1.26%) |
29.68 |
29.55 - 30.10 |
1.3515 times |
Thu 23 October 2025 |
30.09 (2.03%) |
29.77 |
29.69 - 30.28 |
1.3733 times |
Wed 22 October 2025 |
29.49 (0.14%) |
29.48 |
29.10 - 29.59 |
1.2437 times |
Tue 21 October 2025 |
29.45 (-0.14%) |
29.44 |
29.18 - 29.45 |
0.4819 times |
Mon 20 October 2025 |
29.49 (0.14%) |
29.26 |
29.26 - 29.50 |
0.1961 times |
Fri 17 October 2025 |
29.45 (0.34%) |
29.06 |
29.06 - 29.50 |
0.5029 times |
Thu 16 October 2025 |
29.35 (-0.24%) |
29.48 |
29.25 - 29.85 |
1.8544 times |
Wed 15 October 2025 |
29.42 (0.51%) |
29.93 |
29.25 - 29.93 |
0.0733 times |
Tue 14 October 2025 |
29.27 (-1.08%) |
29.00 |
29.00 - 29.51 |
1.2781 times |
Mon 13 October 2025 |
29.59 (-1.53%) |
29.34 |
29.30 - 29.90 |
1.6448 times |
Tue 07 October 2025 |
30.05 (-1.28%) |
30.52 |
30.03 - 30.52 |
0.3981 times |
Weekly price and charts GX Strong weekly Stock price targets for GX NORW are 29.41 and 30.59 | Weekly Target 1 | 28.52 | | Weekly Target 2 | 29.11 | | Weekly Target 3 | 29.696666666667 | | Weekly Target 4 | 30.29 | | Weekly Target 5 | 30.88 |
Weekly price and volumes for G X
| Date |
Closing |
Open |
Range |
Volume |
Fri 24 October 2025 |
29.71 (0.88%) |
29.26 |
29.10 - 30.28 |
1.1106 times |
Fri 17 October 2025 |
29.45 (-2%) |
29.34 |
29.00 - 29.93 |
1.2796 times |
Tue 07 October 2025 |
30.05 (-0.86%) |
30.25 |
30.03 - 30.73 |
0.2245 times |
Fri 03 October 2025 |
30.31 (0.13%) |
30.25 |
29.83 - 30.78 |
1.303 times |
Fri 26 September 2025 |
30.27 (0.8%) |
30.04 |
29.76 - 30.53 |
1.0542 times |
Fri 19 September 2025 |
30.03 (-1.18%) |
30.55 |
29.98 - 31.04 |
0.8589 times |
Fri 12 September 2025 |
30.39 (3.65%) |
29.64 |
29.64 - 30.48 |
0.8138 times |
Fri 05 September 2025 |
29.32 (-1.45%) |
29.16 |
29.12 - 29.72 |
1.0116 times |
Fri 29 August 2025 |
29.75 (0%) |
29.53 |
29.50 - 29.87 |
0.303 times |
Fri 29 August 2025 |
29.75 (-0.23%) |
29.70 |
29.28 - 29.87 |
2.0408 times |
Fri 22 August 2025 |
29.82 (2.37%) |
28.89 |
28.72 - 29.91 |
0.7011 times |

Monthly price and charts GX Strong monthly Stock price targets for GX NORW are 28.47 and 30.25 | Monthly Target 1 | 28.05 | | Monthly Target 2 | 28.88 | | Monthly Target 3 | 29.83 | | Monthly Target 4 | 30.66 | | Monthly Target 5 | 31.61 |
Monthly price and volumes G X
| Date |
Closing |
Open |
Range |
Volume |
Fri 24 October 2025 |
29.71 (-1.66%) |
30.77 |
29.00 - 30.78 |
0.5233 times |
Tue 30 September 2025 |
30.21 (1.55%) |
29.16 |
29.12 - 31.04 |
0.6748 times |
Fri 29 August 2025 |
29.75 (4.39%) |
28.65 |
28.21 - 29.91 |
0.7696 times |
Thu 31 July 2025 |
28.50 (-2.56%) |
28.90 |
28.24 - 29.84 |
1.0455 times |
Mon 30 June 2025 |
29.25 (2.6%) |
28.69 |
28.69 - 31.00 |
2.0379 times |
Fri 30 May 2025 |
28.51 (6.38%) |
26.82 |
26.45 - 29.28 |
0.9265 times |
Wed 30 April 2025 |
26.80 (-1.11%) |
27.11 |
22.84 - 27.45 |
1.2975 times |
Mon 31 March 2025 |
27.10 (8.75%) |
25.52 |
24.49 - 27.55 |
0.9423 times |
Fri 28 February 2025 |
24.92 (-0.2%) |
24.49 |
24.49 - 25.50 |
0.3962 times |
Fri 31 January 2025 |
24.97 (6.44%) |
23.82 |
23.68 - 25.41 |
1.3864 times |
Tue 31 December 2024 |
23.46 (-5.97%) |
25.36 |
23.32 - 25.54 |
0.4079 times |

DMA SMA EMA moving averages of G X NORW
DMA (daily moving average) of G X NORW
| DMA period | DMA value | | 5 day DMA | 29.65 | | 12 day DMA | 29.65 | | 20 day DMA | 29.88 | | 35 day DMA | 29.96 | | 50 day DMA | 29.79 | | 100 day DMA | 29.49 | | 150 day DMA | 28.54 | | 200 day DMA | 27.68 | EMA (exponential moving average) of G X NORW
| EMA period | EMA current | EMA prev | EMA prev2 | | 5 day EMA | 29.7 | 29.69 | 29.49 | | 12 day EMA | 29.72 | 29.72 | 29.65 | | 20 day EMA | 29.77 | 29.78 | 29.75 | | 35 day EMA | 29.73 | 29.73 | 29.71 | | 50 day EMA | 29.69 | 29.69 | 29.67 |
SMA (simple moving average) of G X NORW
| SMA period | SMA current | SMA prev | SMA prev2 | | 5 day SMA | 29.65 | 29.59 | 29.45 | | 12 day SMA | 29.65 | 29.7 | 29.71 | | 20 day SMA | 29.88 | 29.91 | 29.91 | | 35 day SMA | 29.96 | 29.96 | 29.95 | | 50 day SMA | 29.79 | 29.77 | 29.74 | | 100 day SMA | 29.49 | 29.48 | 29.47 | | 150 day SMA | 28.54 | 28.53 | 28.51 | | 200 day SMA | 27.68 | 27.65 | 27.62 |
|
|
