NationalHealthcare NHC full analysis,charts,indicators,moving averages,SMA,DMA,EMA,ADX,MACD,RSINational Healthcare NHC WideScreen charts, DMA,SMA,EMA technical analysis, forecast prediction, by indicators ADX,MACD,RSI,CCI AMEX stock exchange
Daily price and charts and targets NationalHealthcare Strong Daily Stock price targets for NationalHealthcare NHC are 121.32 and 123.05 | Daily Target 1 | 121.02 | | Daily Target 2 | 121.61 | | Daily Target 3 | 122.74666666667 | | Daily Target 4 | 123.34 | | Daily Target 5 | 124.48 |
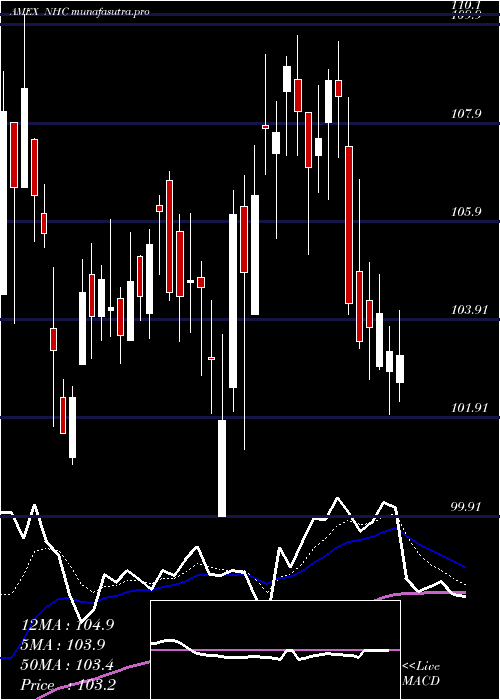
Daily price and volume National Healthcare
| Date |
Closing |
Open |
Range |
Volume |
Fri 24 October 2025 |
122.21 (0.15%) |
123.39 |
122.15 - 123.88 |
0.5581 times |
Thu 23 October 2025 |
122.03 (-0.88%) |
123.64 |
121.09 - 123.64 |
0.1508 times |
Wed 22 October 2025 |
123.11 (1.47%) |
121.25 |
121.00 - 123.86 |
0.611 times |
Tue 21 October 2025 |
121.33 (-1.19%) |
122.66 |
121.17 - 124.22 |
1.4644 times |
Mon 20 October 2025 |
122.79 (0.69%) |
122.86 |
121.70 - 124.00 |
0.4826 times |
Fri 17 October 2025 |
121.95 (0.06%) |
121.90 |
120.53 - 122.56 |
0.724 times |
Thu 16 October 2025 |
121.88 (-0.5%) |
123.22 |
121.13 - 123.22 |
0.5113 times |
Wed 15 October 2025 |
122.49 (0.81%) |
122.95 |
121.16 - 123.41 |
1.0032 times |
Tue 14 October 2025 |
121.50 (1.67%) |
119.00 |
117.22 - 122.26 |
1.552 times |
Mon 13 October 2025 |
119.51 (1.77%) |
118.27 |
117.59 - 120.41 |
2.9426 times |
Fri 10 October 2025 |
117.43 (-1.23%) |
119.02 |
116.42 - 120.65 |
3.134 times |
Weekly price and charts NationalHealthcare Strong weekly Stock price targets for NationalHealthcare NHC are 120 and 123.22 | Weekly Target 1 | 119.26 | | Weekly Target 2 | 120.73 | | Weekly Target 3 | 122.47666666667 | | Weekly Target 4 | 123.95 | | Weekly Target 5 | 125.7 |
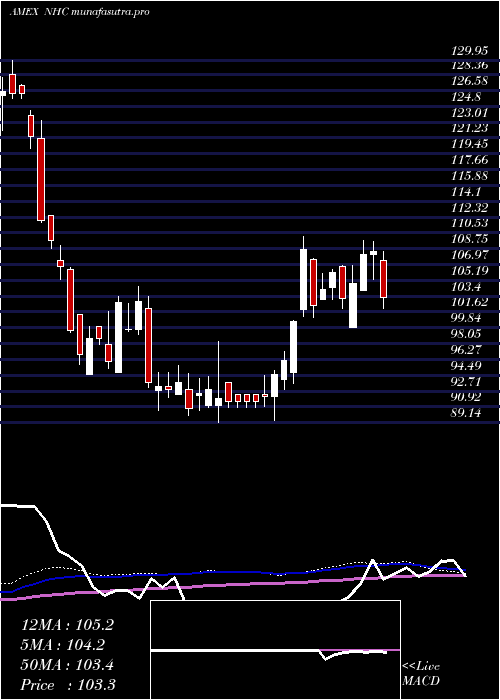
Weekly price and volumes for National Healthcare
| Date |
Closing |
Open |
Range |
Volume |
Fri 24 October 2025 |
122.21 (0.21%) |
122.86 |
121.00 - 124.22 |
0.487 times |
Fri 17 October 2025 |
121.95 (3.85%) |
118.27 |
117.22 - 123.41 |
1.0036 times |
Fri 10 October 2025 |
117.43 (-3.21%) |
121.95 |
116.42 - 121.95 |
1.163 times |
Fri 03 October 2025 |
121.32 (-4.03%) |
126.33 |
119.45 - 127.25 |
0.9276 times |
Fri 26 September 2025 |
126.41 (7.84%) |
118.11 |
116.15 - 126.89 |
1.5139 times |
Fri 19 September 2025 |
117.22 (1.95%) |
116.46 |
114.59 - 122.10 |
3.069 times |
Fri 12 September 2025 |
114.98 (0.03%) |
115.00 |
112.40 - 116.13 |
0.6586 times |
Fri 05 September 2025 |
114.94 (1.29%) |
112.41 |
111.24 - 115.20 |
0.4417 times |
Fri 29 August 2025 |
113.48 (0%) |
113.01 |
112.42 - 113.60 |
0.1158 times |
Fri 29 August 2025 |
113.48 (-1.17%) |
115.33 |
110.83 - 115.33 |
0.6198 times |
Fri 22 August 2025 |
114.82 (6.81%) |
107.37 |
107.32 - 114.94 |
0.6036 times |
Monthly price and charts NationalHealthcare Strong monthly Stock price targets for NationalHealthcare NHC are 119.32 and 128.52 | Monthly Target 1 | 112.22 | | Monthly Target 2 | 117.21 | | Monthly Target 3 | 121.41666666667 | | Monthly Target 4 | 126.41 | | Monthly Target 5 | 130.62 |
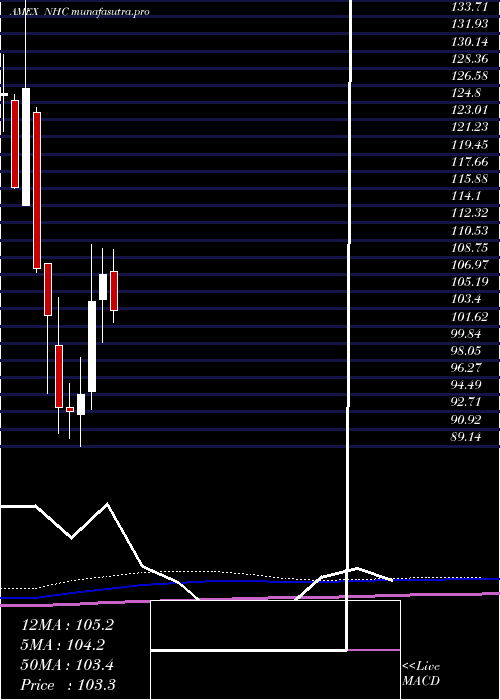
Monthly price and volumes National Healthcare
| Date |
Closing |
Open |
Range |
Volume |
Fri 24 October 2025 |
122.21 (0.58%) |
121.27 |
116.42 - 125.62 |
0.7441 times |
Tue 30 September 2025 |
121.51 (7.08%) |
112.41 |
111.24 - 127.25 |
1.4801 times |
Fri 29 August 2025 |
113.48 (18.17%) |
95.58 |
94.04 - 115.33 |
0.7364 times |
Thu 31 July 2025 |
96.03 (-10.26%) |
107.25 |
93.54 - 109.56 |
1.1434 times |
Mon 30 June 2025 |
107.01 (2.76%) |
104.34 |
99.91 - 109.68 |
1.3032 times |
Fri 30 May 2025 |
104.14 (10.21%) |
94.88 |
92.91 - 110.10 |
0.6909 times |
Wed 30 April 2025 |
94.49 (1.82%) |
92.42 |
89.14 - 98.32 |
0.8092 times |
Mon 31 March 2025 |
92.80 (-0.4%) |
93.17 |
89.95 - 95.62 |
1.1377 times |
Fri 28 February 2025 |
93.17 (-9.25%) |
99.64 |
90.51 - 104.54 |
0.8907 times |
Fri 31 January 2025 |
102.67 (-4.55%) |
108.13 |
94.62 - 108.13 |
1.0644 times |
Tue 31 December 2024 |
107.56 (-14.78%) |
123.73 |
107.20 - 124.26 |
0.7273 times |
DMA SMA EMA moving averages of National Healthcare NHC
DMA (daily moving average) of National Healthcare NHC
| DMA period | DMA value | | 5 day DMA | 122.29 | | 12 day DMA | 121.26 | | 20 day DMA | 121.16 | | 35 day DMA | 119.96 | | 50 day DMA | 117.62 | | 100 day DMA | 110.02 | | 150 day DMA | 105.58 | | 200 day DMA | 103.4 | EMA (exponential moving average) of National Healthcare NHC
| EMA period | EMA current | EMA prev | EMA prev2 | | 5 day EMA | 122.15 | 122.12 | 122.16 | | 12 day EMA | 121.63 | 121.53 | 121.44 | | 20 day EMA | 120.97 | 120.84 | 120.71 | | 35 day EMA | 118.99 | 118.8 | 118.61 | | 50 day EMA | 117.19 | 116.99 | 116.78 |
SMA (simple moving average) of National Healthcare NHC
| SMA period | SMA current | SMA prev | SMA prev2 | | 5 day SMA | 122.29 | 122.24 | 122.21 | | 12 day SMA | 121.26 | 121.08 | 120.72 | | 20 day SMA | 121.16 | 121.37 | 121.38 | | 35 day SMA | 119.96 | 119.75 | 119.55 | | 50 day SMA | 117.62 | 117.33 | 117.01 | | 100 day SMA | 110.02 | 109.84 | 109.66 | | 150 day SMA | 105.58 | 105.37 | 105.16 | | 200 day SMA | 103.4 | 103.29 | 103.18 |
|
|
