ShortMaturity NEAR full analysis,charts,indicators,moving averages,SMA,DMA,EMA,ADX,MACD,RSIShort Maturity NEAR WideScreen charts, DMA,SMA,EMA technical analysis, forecast prediction, by indicators ADX,MACD,RSI,CCI AMEX stock exchange
Daily price and charts and targets ShortMaturity Strong Daily Stock price targets for ShortMaturity NEAR are 51.29 and 51.33 | Daily Target 1 | 51.28 | | Daily Target 2 | 51.29 | | Daily Target 3 | 51.316666666667 | | Daily Target 4 | 51.33 | | Daily Target 5 | 51.36 |
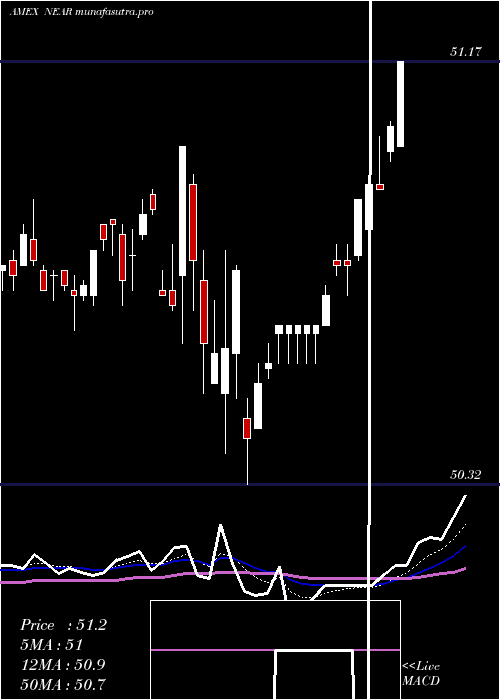
Daily price and volume Short Maturity
| Date |
Closing |
Open |
Range |
Volume |
Thu 23 October 2025 |
51.31 (-0.02%) |
51.33 |
51.30 - 51.34 |
1.3517 times |
Wed 22 October 2025 |
51.32 (-0.02%) |
51.33 |
51.30 - 51.34 |
0.5137 times |
Tue 21 October 2025 |
51.33 (0.02%) |
51.33 |
51.33 - 51.35 |
0.5769 times |
Mon 20 October 2025 |
51.32 (0.04%) |
51.12 |
51.12 - 51.32 |
1.2776 times |
Fri 17 October 2025 |
51.30 (-0.06%) |
51.33 |
51.28 - 51.34 |
1.2113 times |
Thu 16 October 2025 |
51.33 (0.12%) |
51.27 |
51.24 - 51.33 |
0.7305 times |
Wed 15 October 2025 |
51.27 (0.04%) |
51.25 |
51.23 - 51.28 |
2.5939 times |
Tue 14 October 2025 |
51.25 (0.14%) |
51.20 |
51.19 - 51.27 |
0.6552 times |
Mon 13 October 2025 |
51.18 (0%) |
51.21 |
51.16 - 51.23 |
0.5834 times |
Fri 10 October 2025 |
51.18 (0.1%) |
51.19 |
51.15 - 51.20 |
0.5058 times |
Thu 09 October 2025 |
51.13 (-0.08%) |
51.17 |
51.12 - 51.17 |
0.8789 times |
Weekly price and charts ShortMaturity Strong weekly Stock price targets for ShortMaturity NEAR are 51.22 and 51.45 | Weekly Target 1 | 51.03 | | Weekly Target 2 | 51.17 | | Weekly Target 3 | 51.26 | | Weekly Target 4 | 51.4 | | Weekly Target 5 | 51.49 |
Weekly price and volumes for Short Maturity
| Date |
Closing |
Open |
Range |
Volume |
Thu 23 October 2025 |
51.31 (0.02%) |
51.12 |
51.12 - 51.35 |
0.932 times |
Fri 17 October 2025 |
51.30 (0.23%) |
51.21 |
51.16 - 51.34 |
1.4467 times |
Fri 10 October 2025 |
51.18 (0.02%) |
51.17 |
51.12 - 51.20 |
1.0172 times |
Fri 03 October 2025 |
51.17 (-0.12%) |
51.25 |
51.13 - 51.36 |
1.385 times |
Fri 26 September 2025 |
51.23 (-0.08%) |
51.28 |
51.20 - 51.33 |
1.0753 times |
Fri 19 September 2025 |
51.27 (0.04%) |
51.29 |
51.24 - 51.35 |
0.9116 times |
Fri 12 September 2025 |
51.25 (0.06%) |
51.25 |
51.21 - 51.28 |
0.8933 times |
Fri 05 September 2025 |
51.22 (-0.08%) |
51.00 |
51.00 - 51.26 |
0.9711 times |
Fri 29 August 2025 |
51.26 (0%) |
51.25 |
51.24 - 51.28 |
0.3606 times |
Fri 29 August 2025 |
51.26 (0.16%) |
51.16 |
51.14 - 51.28 |
1.0072 times |
Fri 22 August 2025 |
51.18 (0.27%) |
51.05 |
51.02 - 51.18 |
0.8663 times |

Monthly price and charts ShortMaturity Strong monthly Stock price targets for ShortMaturity NEAR are 51.22 and 51.46 | Monthly Target 1 | 51.02 | | Monthly Target 2 | 51.17 | | Monthly Target 3 | 51.263333333333 | | Monthly Target 4 | 51.41 | | Monthly Target 5 | 51.5 |
Monthly price and volumes Short Maturity
| Date |
Closing |
Open |
Range |
Volume |
Thu 23 October 2025 |
51.31 (0.06%) |
51.17 |
51.12 - 51.36 |
1.0266 times |
Tue 30 September 2025 |
51.28 (0.04%) |
51.00 |
51.00 - 51.35 |
1.047 times |
Fri 29 August 2025 |
51.26 (0.39%) |
50.89 |
50.89 - 51.28 |
0.9327 times |
Thu 31 July 2025 |
51.06 (-0.08%) |
50.94 |
50.80 - 51.11 |
0.9551 times |
Mon 30 June 2025 |
51.10 (0.43%) |
50.70 |
50.65 - 51.12 |
0.8816 times |
Fri 30 May 2025 |
50.88 (-0.57%) |
50.92 |
50.64 - 51.06 |
0.9407 times |
Wed 30 April 2025 |
51.17 (0.59%) |
50.71 |
50.32 - 51.17 |
1.4694 times |
Mon 31 March 2025 |
50.87 (-0.04%) |
50.72 |
50.63 - 50.91 |
0.8003 times |
Fri 28 February 2025 |
50.89 (0.24%) |
50.52 |
50.46 - 50.89 |
0.9917 times |
Fri 31 January 2025 |
50.77 (0.53%) |
50.50 |
50.25 - 50.77 |
0.9549 times |
Tue 31 December 2024 |
50.50 (-0.47%) |
50.80 |
50.27 - 50.82 |
0.637 times |

DMA SMA EMA moving averages of Short Maturity NEAR
DMA (daily moving average) of Short Maturity NEAR
| DMA period | DMA value | | 5 day DMA | 51.32 | | 12 day DMA | 51.26 | | 20 day DMA | 51.24 | | 35 day DMA | 51.25 | | 50 day DMA | 51.22 | | 100 day DMA | 51.06 | | 150 day DMA | 50.96 | | 200 day DMA | 50.88 | EMA (exponential moving average) of Short Maturity NEAR
| EMA period | EMA current | EMA prev | EMA prev2 | | 5 day EMA | 51.31 | 51.31 | 51.3 | | 12 day EMA | 51.28 | 51.27 | 51.26 | | 20 day EMA | 51.26 | 51.26 | 51.25 | | 35 day EMA | 51.24 | 51.24 | 51.24 | | 50 day EMA | 51.21 | 51.21 | 51.21 |
SMA (simple moving average) of Short Maturity NEAR
| SMA period | SMA current | SMA prev | SMA prev2 | | 5 day SMA | 51.32 | 51.32 | 51.31 | | 12 day SMA | 51.26 | 51.25 | 51.23 | | 20 day SMA | 51.24 | 51.23 | 51.23 | | 35 day SMA | 51.25 | 51.24 | 51.24 | | 50 day SMA | 51.22 | 51.21 | 51.21 | | 100 day SMA | 51.06 | 51.06 | 51.05 | | 150 day SMA | 50.96 | 50.96 | 50.95 | | 200 day SMA | 50.88 | 50.88 | 50.88 |
|
|
