MexcoEnergy MXC full analysis,charts,indicators,moving averages,SMA,DMA,EMA,ADX,MACD,RSIMexco Energy MXC WideScreen charts, DMA,SMA,EMA technical analysis, forecast prediction, by indicators ADX,MACD,RSI,CCI AMEX stock exchange
Daily price and charts and targets MexcoEnergy Strong Daily Stock price targets for MexcoEnergy MXC are 8.82 and 9.77 | Daily Target 1 | 8.61 | | Daily Target 2 | 9.03 | | Daily Target 3 | 9.5633333333333 | | Daily Target 4 | 9.98 | | Daily Target 5 | 10.51 |
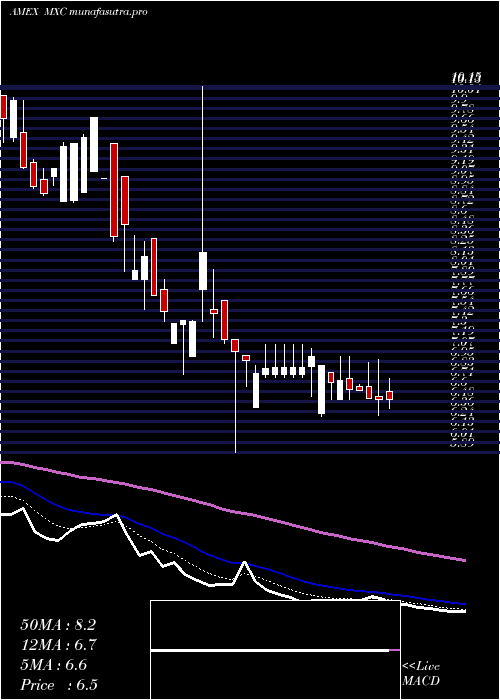
Daily price and volume Mexco Energy
| Date |
Closing |
Open |
Range |
Volume |
Thu 23 October 2025 |
9.44 (4.89%) |
9.51 |
9.15 - 10.10 |
1.0238 times |
Wed 22 October 2025 |
9.00 (0.11%) |
8.51 |
8.51 - 9.47 |
1.0808 times |
Tue 21 October 2025 |
8.99 (-2.28%) |
9.25 |
8.95 - 9.41 |
2.7745 times |
Mon 20 October 2025 |
9.20 (-2.44%) |
9.50 |
9.20 - 9.57 |
0.3855 times |
Fri 17 October 2025 |
9.43 (0.32%) |
9.20 |
8.81 - 9.49 |
1.1025 times |
Thu 16 October 2025 |
9.40 (-1.78%) |
9.80 |
9.40 - 9.80 |
0.7533 times |
Wed 15 October 2025 |
9.57 (5.98%) |
9.25 |
9.17 - 9.65 |
2.0579 times |
Tue 14 October 2025 |
9.03 (0.11%) |
8.92 |
8.92 - 9.03 |
0.2389 times |
Mon 13 October 2025 |
9.02 (0.33%) |
8.87 |
8.87 - 9.02 |
0.2389 times |
Mon 06 October 2025 |
8.99 (2.16%) |
8.62 |
8.62 - 9.46 |
0.344 times |
Fri 03 October 2025 |
8.80 (-2.22%) |
9.00 |
8.42 - 9.10 |
0.4055 times |
Weekly price and charts MexcoEnergy Strong weekly Stock price targets for MexcoEnergy MXC are 8.18 and 9.77 | Weekly Target 1 | 7.76 | | Weekly Target 2 | 8.6 | | Weekly Target 3 | 9.35 | | Weekly Target 4 | 10.19 | | Weekly Target 5 | 10.94 |
Weekly price and volumes for Mexco Energy
| Date |
Closing |
Open |
Range |
Volume |
Thu 23 October 2025 |
9.44 (0.11%) |
9.50 |
8.51 - 10.10 |
1.6236 times |
Fri 17 October 2025 |
9.43 (4.89%) |
8.87 |
8.81 - 9.80 |
1.3543 times |
Mon 06 October 2025 |
8.99 (2.16%) |
8.62 |
8.62 - 9.46 |
0.1061 times |
Fri 03 October 2025 |
8.80 (-6.88%) |
9.34 |
8.42 - 9.45 |
0.7562 times |
Fri 26 September 2025 |
9.45 (5.12%) |
8.98 |
8.53 - 9.45 |
2.142 times |
Fri 19 September 2025 |
8.99 (7.66%) |
8.37 |
8.35 - 8.99 |
1.3543 times |
Fri 12 September 2025 |
8.35 (-2.91%) |
8.44 |
8.30 - 8.82 |
0.9407 times |
Fri 05 September 2025 |
8.60 (6.17%) |
8.18 |
8.15 - 8.92 |
1.2863 times |
Fri 29 August 2025 |
8.10 (0%) |
8.27 |
8.10 - 8.27 |
0.068 times |
Fri 29 August 2025 |
8.10 (0.62%) |
7.95 |
7.95 - 8.39 |
0.3683 times |
Fri 22 August 2025 |
8.05 (-1.23%) |
8.10 |
7.85 - 8.33 |
0.6913 times |

Monthly price and charts MexcoEnergy Strong monthly Stock price targets for MexcoEnergy MXC are 8.93 and 10.61 | Monthly Target 1 | 7.64 | | Monthly Target 2 | 8.54 | | Monthly Target 3 | 9.32 | | Monthly Target 4 | 10.22 | | Monthly Target 5 | 11 |
Monthly price and volumes Mexco Energy
| Date |
Closing |
Open |
Range |
Volume |
Thu 23 October 2025 |
9.44 (3.06%) |
8.84 |
8.42 - 10.10 |
0.2231 times |
Tue 30 September 2025 |
9.16 (13.09%) |
8.18 |
8.15 - 9.45 |
0.3805 times |
Fri 29 August 2025 |
8.10 (-1.82%) |
8.20 |
7.85 - 8.98 |
0.2082 times |
Thu 31 July 2025 |
8.25 (-6.99%) |
8.96 |
7.80 - 9.28 |
0.6788 times |
Mon 30 June 2025 |
8.87 (30.63%) |
6.79 |
6.75 - 16.00 |
5.2979 times |
Fri 30 May 2025 |
6.79 (4.46%) |
6.60 |
5.98 - 7.26 |
0.1624 times |
Wed 30 April 2025 |
6.50 (-20.44%) |
8.38 |
5.89 - 10.15 |
0.6653 times |
Fri 28 March 2025 |
8.17 (-27.76%) |
11.19 |
7.55 - 11.26 |
0.3588 times |
Fri 28 February 2025 |
11.31 (-6.53%) |
12.20 |
11.00 - 12.66 |
0.4624 times |
Fri 31 January 2025 |
12.10 (7.27%) |
11.41 |
11.11 - 14.11 |
1.5626 times |
Tue 31 December 2024 |
11.28 (-6.7%) |
12.00 |
10.55 - 12.00 |
0.9264 times |

DMA SMA EMA moving averages of Mexco Energy MXC
DMA (daily moving average) of Mexco Energy MXC
| DMA period | DMA value | | 5 day DMA | 9.21 | | 12 day DMA | 9.16 | | 20 day DMA | 9.16 | | 35 day DMA | 8.92 | | 50 day DMA | 8.69 | | 100 day DMA | 8.58 | | 150 day DMA | 8.18 | | 200 day DMA | 9.03 | EMA (exponential moving average) of Mexco Energy MXC
| EMA period | EMA current | EMA prev | EMA prev2 | | 5 day EMA | 9.23 | 9.12 | 9.18 | | 12 day EMA | 9.18 | 9.13 | 9.15 | | 20 day EMA | 9.11 | 9.07 | 9.08 | | 35 day EMA | 8.92 | 8.89 | 8.88 | | 50 day EMA | 8.68 | 8.65 | 8.64 |
SMA (simple moving average) of Mexco Energy MXC
| SMA period | SMA current | SMA prev | SMA prev2 | | 5 day SMA | 9.21 | 9.2 | 9.32 | | 12 day SMA | 9.16 | 9.12 | 9.13 | | 20 day SMA | 9.16 | 9.14 | 9.13 | | 35 day SMA | 8.92 | 8.88 | 8.85 | | 50 day SMA | 8.69 | 8.67 | 8.65 | | 100 day SMA | 8.58 | 8.56 | 8.54 | | 150 day SMA | 8.18 | 8.17 | 8.17 | | 200 day SMA | 9.03 | 9.04 | 9.05 |
|
|
