SP MUB full analysis,charts,indicators,moving averages,SMA,DMA,EMA,ADX,MACD,RSIS P MUB WideScreen charts, DMA,SMA,EMA technical analysis, forecast prediction, by indicators ADX,MACD,RSI,CCI AMEX stock exchange
Daily price and charts and targets SP Strong Daily Stock price targets for SP MUB are 107.2 and 107.75 | Daily Target 1 | 107.09 | | Daily Target 2 | 107.3 | | Daily Target 3 | 107.63666666667 | | Daily Target 4 | 107.85 | | Daily Target 5 | 108.19 |
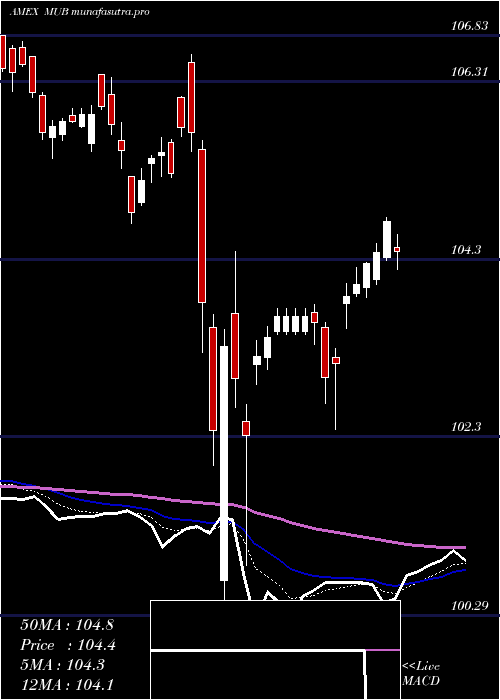
Daily price and volume S P
| Date |
Closing |
Open |
Range |
Volume |
Thu 23 October 2025 |
107.52 (-0.06%) |
107.97 |
107.42 - 107.97 |
0.9319 times |
Wed 22 October 2025 |
107.58 (0%) |
106.82 |
106.82 - 107.69 |
0.7475 times |
Tue 21 October 2025 |
107.58 (0.06%) |
107.60 |
107.52 - 107.65 |
1.441 times |
Mon 20 October 2025 |
107.52 (0.09%) |
107.26 |
106.55 - 107.62 |
0.7245 times |
Fri 17 October 2025 |
107.42 (0%) |
108.00 |
107.31 - 108.00 |
0.7645 times |
Thu 16 October 2025 |
107.42 (0.3%) |
107.10 |
106.45 - 107.44 |
1.4084 times |
Wed 15 October 2025 |
107.10 (0.14%) |
107.02 |
106.96 - 107.13 |
1.2736 times |
Tue 14 October 2025 |
106.95 (-0.06%) |
106.99 |
106.90 - 107.04 |
0.7382 times |
Mon 13 October 2025 |
107.01 (0.15%) |
106.90 |
106.84 - 107.03 |
0.4481 times |
Fri 10 October 2025 |
106.85 (0.27%) |
106.81 |
106.66 - 106.89 |
1.5225 times |
Thu 09 October 2025 |
106.56 (-0.01%) |
106.54 |
106.45 - 106.60 |
0.7094 times |
Weekly price and charts SP Strong weekly Stock price targets for SP MUB are 107.04 and 108.46 | Weekly Target 1 | 105.93 | | Weekly Target 2 | 106.72 | | Weekly Target 3 | 107.34666666667 | | Weekly Target 4 | 108.14 | | Weekly Target 5 | 108.77 |
Weekly price and volumes for S P
| Date |
Closing |
Open |
Range |
Volume |
Thu 23 October 2025 |
107.52 (0.09%) |
107.26 |
106.55 - 107.97 |
0.7166 times |
Fri 17 October 2025 |
107.42 (0.53%) |
106.90 |
106.45 - 108.00 |
0.8635 times |
Fri 10 October 2025 |
106.85 (0.44%) |
106.35 |
106.24 - 107.00 |
0.856 times |
Fri 03 October 2025 |
106.38 (0.11%) |
106.32 |
106.27 - 106.58 |
0.9356 times |
Fri 26 September 2025 |
106.26 (-0.2%) |
106.50 |
106.12 - 106.57 |
1.0545 times |
Fri 19 September 2025 |
106.47 (0.04%) |
106.58 |
106.38 - 107.07 |
1.7466 times |
Fri 12 September 2025 |
106.43 (1.12%) |
105.34 |
105.32 - 106.50 |
1.4552 times |
Fri 05 September 2025 |
105.25 (0.76%) |
104.06 |
103.86 - 105.25 |
0.9954 times |
Fri 29 August 2025 |
104.46 (0%) |
104.43 |
104.42 - 104.53 |
0.1544 times |
Fri 29 August 2025 |
104.46 (0.22%) |
104.13 |
104.13 - 104.55 |
1.2224 times |
Fri 22 August 2025 |
104.23 (0.16%) |
104.09 |
103.83 - 104.36 |
1.307 times |

Monthly price and charts SP Strong monthly Stock price targets for SP MUB are 106.88 and 108.64 | Monthly Target 1 | 105.49 | | Monthly Target 2 | 106.51 | | Monthly Target 3 | 107.25333333333 | | Monthly Target 4 | 108.27 | | Monthly Target 5 | 109.01 |
Monthly price and volumes S P
| Date |
Closing |
Open |
Range |
Volume |
Thu 23 October 2025 |
107.52 (0.97%) |
106.39 |
106.24 - 108.00 |
0.5006 times |
Tue 30 September 2025 |
106.49 (1.94%) |
104.06 |
103.86 - 107.07 |
0.9681 times |
Fri 29 August 2025 |
104.46 (0.57%) |
103.98 |
103.83 - 104.55 |
0.8825 times |
Thu 31 July 2025 |
103.87 (-0.58%) |
104.19 |
103.14 - 104.37 |
1.1845 times |
Mon 30 June 2025 |
104.48 (0.61%) |
103.57 |
103.18 - 104.53 |
0.9507 times |
Fri 30 May 2025 |
103.85 (-0.84%) |
104.44 |
103.43 - 104.61 |
1.0938 times |
Wed 30 April 2025 |
104.73 (-0.67%) |
105.47 |
100.29 - 106.61 |
1.9799 times |
Mon 31 March 2025 |
105.44 (-2.08%) |
107.11 |
104.71 - 107.36 |
0.8764 times |
Fri 28 February 2025 |
107.68 (1.07%) |
106.52 |
105.97 - 107.72 |
0.6394 times |
Fri 31 January 2025 |
106.54 (-0.01%) |
106.68 |
105.00 - 106.85 |
0.9241 times |
Tue 31 December 2024 |
106.55 (-1.42%) |
108.50 |
105.57 - 108.51 |
0.7134 times |

DMA SMA EMA moving averages of S P MUB
DMA (daily moving average) of S P MUB
| DMA period | DMA value | | 5 day DMA | 107.52 | | 12 day DMA | 107.17 | | 20 day DMA | 106.87 | | 35 day DMA | 106.62 | | 50 day DMA | 105.91 | | 100 day DMA | 104.89 | | 150 day DMA | 104.66 | | 200 day DMA | 105.11 | EMA (exponential moving average) of S P MUB
| EMA period | EMA current | EMA prev | EMA prev2 | | 5 day EMA | 107.47 | 107.45 | 107.39 | | 12 day EMA | 107.22 | 107.17 | 107.09 | | 20 day EMA | 106.96 | 106.9 | 106.83 | | 35 day EMA | 106.41 | 106.34 | 106.27 | | 50 day EMA | 105.92 | 105.85 | 105.78 |
SMA (simple moving average) of S P MUB
| SMA period | SMA current | SMA prev | SMA prev2 | | 5 day SMA | 107.52 | 107.5 | 107.41 | | 12 day SMA | 107.17 | 107.09 | 107 | | 20 day SMA | 106.87 | 106.81 | 106.74 | | 35 day SMA | 106.62 | 106.53 | 106.44 | | 50 day SMA | 105.91 | 105.84 | 105.77 | | 100 day SMA | 104.89 | 104.86 | 104.82 | | 150 day SMA | 104.66 | 104.65 | 104.64 | | 200 day SMA | 105.11 | 105.11 | 105.1 |
|
|
