LhaMarket MSTB full analysis,charts,indicators,moving averages,SMA,DMA,EMA,ADX,MACD,RSILha Market MSTB WideScreen charts, DMA,SMA,EMA technical analysis, forecast prediction, by indicators ADX,MACD,RSI,CCI AMEX stock exchange
Daily price and charts and targets LhaMarket Strong Daily Stock price targets for LhaMarket MSTB are 40.21 and 41.23 | Daily Target 1 | 39.49 | | Daily Target 2 | 39.9 | | Daily Target 3 | 40.513333333333 | | Daily Target 4 | 40.92 | | Daily Target 5 | 41.53 |
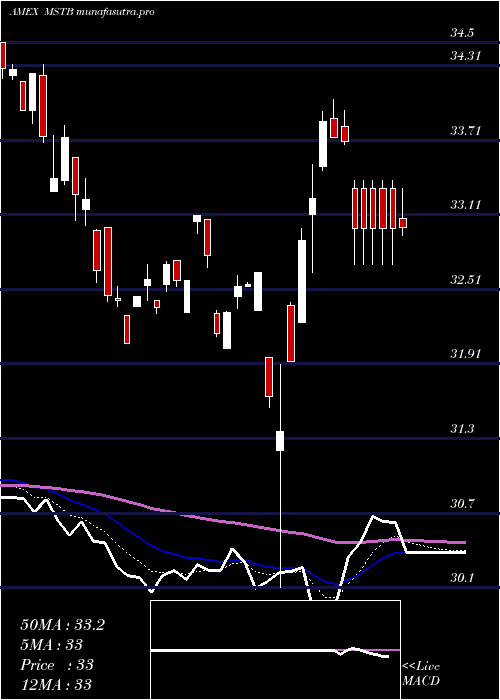
Daily price and volume Lha Market
| Date |
Closing |
Open |
Range |
Volume |
Thu 23 October 2025 |
40.30 (1.08%) |
40.14 |
40.11 - 41.13 |
0.3519 times |
Wed 22 October 2025 |
39.87 (-0.82%) |
40.16 |
39.87 - 40.16 |
0.116 times |
Tue 21 October 2025 |
40.20 (0.17%) |
40.22 |
40.18 - 40.31 |
0.314 times |
Mon 20 October 2025 |
40.13 (0.12%) |
40.09 |
40.09 - 40.22 |
7.9041 times |
Fri 17 October 2025 |
40.08 (0.17%) |
40.18 |
40.08 - 41.16 |
0.1283 times |
Thu 16 October 2025 |
40.01 (0.48%) |
39.96 |
39.92 - 40.01 |
0.2467 times |
Wed 15 October 2025 |
39.82 (0.4%) |
39.67 |
39.67 - 40.12 |
0.3904 times |
Tue 14 October 2025 |
39.66 (0.38%) |
39.23 |
39.17 - 39.88 |
0.1747 times |
Mon 13 October 2025 |
39.51 (1.13%) |
39.04 |
39.04 - 39.56 |
0.3413 times |
Fri 10 October 2025 |
39.07 (-2.54%) |
39.35 |
39.07 - 39.35 |
0.0328 times |
Thu 09 October 2025 |
40.09 (-0.27%) |
40.15 |
39.96 - 40.19 |
0.4259 times |
Weekly price and charts LhaMarket Strong weekly Stock price targets for LhaMarket MSTB are 40.09 and 41.35 | Weekly Target 1 | 39.17 | | Weekly Target 2 | 39.74 | | Weekly Target 3 | 40.433333333333 | | Weekly Target 4 | 41 | | Weekly Target 5 | 41.69 |
Weekly price and volumes for Lha Market
| Date |
Closing |
Open |
Range |
Volume |
Thu 23 October 2025 |
40.30 (0.55%) |
40.09 |
39.87 - 41.13 |
2.6102 times |
Fri 17 October 2025 |
40.08 (2.59%) |
39.04 |
39.04 - 41.16 |
0.385 times |
Fri 10 October 2025 |
39.07 (-2.25%) |
39.38 |
39.07 - 40.20 |
0.3095 times |
Fri 03 October 2025 |
39.97 (1.42%) |
39.65 |
39.54 - 40.40 |
0.5398 times |
Fri 26 September 2025 |
39.41 (-0.68%) |
39.50 |
39.23 - 39.66 |
0.5767 times |
Fri 19 September 2025 |
39.68 (1.28%) |
39.29 |
39.08 - 39.68 |
0.9845 times |
Fri 12 September 2025 |
39.18 (1.79%) |
38.60 |
38.54 - 39.22 |
0.5029 times |
Fri 05 September 2025 |
38.49 (0.08%) |
38.28 |
38.22 - 38.66 |
3.9617 times |
Fri 29 August 2025 |
38.46 (0%) |
38.42 |
38.42 - 38.46 |
0.0164 times |
Fri 29 August 2025 |
38.46 (0.18%) |
38.41 |
38.25 - 38.67 |
0.1132 times |
Fri 22 August 2025 |
38.39 (0.21%) |
37.98 |
37.78 - 38.47 |
0.2199 times |

Monthly price and charts LhaMarket Strong monthly Stock price targets for LhaMarket MSTB are 39.67 and 41.79 | Monthly Target 1 | 38.05 | | Monthly Target 2 | 39.17 | | Monthly Target 3 | 40.166666666667 | | Monthly Target 4 | 41.29 | | Monthly Target 5 | 42.29 |
Monthly price and volumes Lha Market
| Date |
Closing |
Open |
Range |
Volume |
Thu 23 October 2025 |
40.30 (1.33%) |
39.65 |
39.04 - 41.16 |
1.6184 times |
Tue 30 September 2025 |
39.77 (3.41%) |
38.28 |
38.22 - 39.77 |
2.692 times |
Fri 29 August 2025 |
38.46 (1.42%) |
37.33 |
37.33 - 38.67 |
0.3543 times |
Thu 31 July 2025 |
37.92 (1.85%) |
37.24 |
37.15 - 38.53 |
0.3775 times |
Mon 30 June 2025 |
37.23 (3.88%) |
35.69 |
35.69 - 37.23 |
0.3117 times |
Fri 30 May 2025 |
35.84 (4.95%) |
34.38 |
34.11 - 36.14 |
0.5267 times |
Wed 30 April 2025 |
34.15 (5.66%) |
32.45 |
30.10 - 34.15 |
1.3194 times |
Mon 31 March 2025 |
32.32 (-5.64%) |
34.23 |
32.03 - 34.32 |
1.0241 times |
Fri 28 February 2025 |
34.25 (-1.13%) |
34.05 |
33.85 - 35.10 |
1.0329 times |
Fri 31 January 2025 |
34.64 (2.45%) |
34.28 |
33.40 - 35.16 |
0.743 times |
Tue 31 December 2024 |
33.81 (-3.18%) |
35.07 |
33.34 - 35.44 |
0.9087 times |

DMA SMA EMA moving averages of Lha Market MSTB
DMA (daily moving average) of Lha Market MSTB
| DMA period | DMA value | | 5 day DMA | 40.12 | | 12 day DMA | 39.91 | | 20 day DMA | 39.88 | | 35 day DMA | 39.57 | | 50 day DMA | 39.2 | | 100 day DMA | 38.24 | | 150 day DMA | 36.8 | | 200 day DMA | 36.12 | EMA (exponential moving average) of Lha Market MSTB
| EMA period | EMA current | EMA prev | EMA prev2 | | 5 day EMA | 40.09 | 39.99 | 40.05 | | 12 day EMA | 39.96 | 39.9 | 39.91 | | 20 day EMA | 39.83 | 39.78 | 39.77 | | 35 day EMA | 39.51 | 39.46 | 39.44 | | 50 day EMA | 39.2 | 39.16 | 39.13 |
SMA (simple moving average) of Lha Market MSTB
| SMA period | SMA current | SMA prev | SMA prev2 | | 5 day SMA | 40.12 | 40.06 | 40.05 | | 12 day SMA | 39.91 | 39.88 | 39.9 | | 20 day SMA | 39.88 | 39.83 | 39.81 | | 35 day SMA | 39.57 | 39.53 | 39.48 | | 50 day SMA | 39.2 | 39.16 | 39.13 | | 100 day SMA | 38.24 | 38.2 | 38.16 | | 150 day SMA | 36.8 | 36.75 | 36.7 | | 200 day SMA | 36.12 | 36.09 | 36.06 |
|
|
