LongMunicipal MLN full analysis,charts,indicators,moving averages,SMA,DMA,EMA,ADX,MACD,RSILong Municipal MLN WideScreen charts, DMA,SMA,EMA technical analysis, forecast prediction, by indicators ADX,MACD,RSI,CCI AMEX stock exchange
Daily price and charts and targets LongMunicipal Strong Daily Stock price targets for LongMunicipal MLN are 17.75 and 17.79 | Daily Target 1 | 17.71 | | Daily Target 2 | 17.74 | | Daily Target 3 | 17.753333333333 | | Daily Target 4 | 17.78 | | Daily Target 5 | 17.79 |
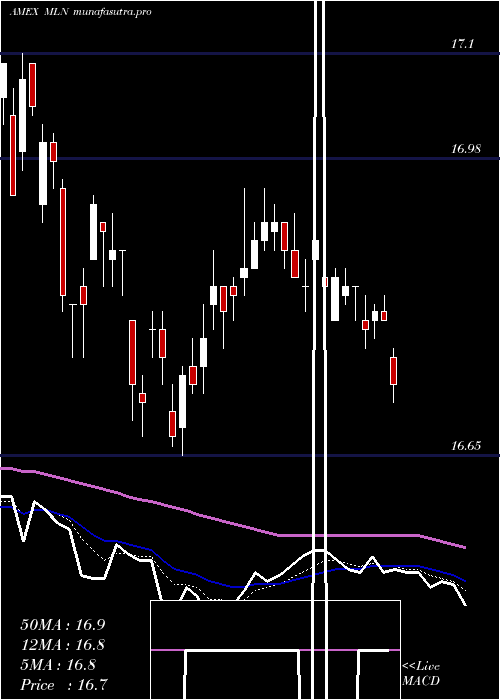
Daily price and volume Long Municipal
| Date |
Closing |
Open |
Range |
Volume |
Fri 24 October 2025 |
17.76 (0.23%) |
17.75 |
17.73 - 17.77 |
0.6569 times |
Thu 23 October 2025 |
17.72 (-0.11%) |
17.69 |
17.68 - 17.72 |
0.6611 times |
Wed 22 October 2025 |
17.74 (0.06%) |
17.72 |
17.71 - 17.76 |
0.8843 times |
Tue 21 October 2025 |
17.73 (0%) |
17.76 |
17.68 - 17.77 |
2.0226 times |
Mon 20 October 2025 |
17.73 (0%) |
17.73 |
17.73 - 17.77 |
0.7764 times |
Fri 17 October 2025 |
17.73 (0.17%) |
17.70 |
17.68 - 17.73 |
0.4526 times |
Thu 16 October 2025 |
17.70 (0.34%) |
17.64 |
17.64 - 17.70 |
0.5859 times |
Wed 15 October 2025 |
17.64 (0.17%) |
17.64 |
17.62 - 17.67 |
3.0857 times |
Tue 14 October 2025 |
17.61 (-0.17%) |
17.63 |
17.59 - 17.64 |
0.3308 times |
Mon 13 October 2025 |
17.64 (0.92%) |
17.57 |
17.54 - 17.65 |
0.5438 times |
Tue 07 October 2025 |
17.48 (0.06%) |
17.48 |
17.47 - 17.49 |
1.9555 times |
Weekly price and charts LongMunicipal Strong weekly Stock price targets for LongMunicipal MLN are 17.72 and 17.81 | Weekly Target 1 | 17.65 | | Weekly Target 2 | 17.7 | | Weekly Target 3 | 17.736666666667 | | Weekly Target 4 | 17.79 | | Weekly Target 5 | 17.83 |
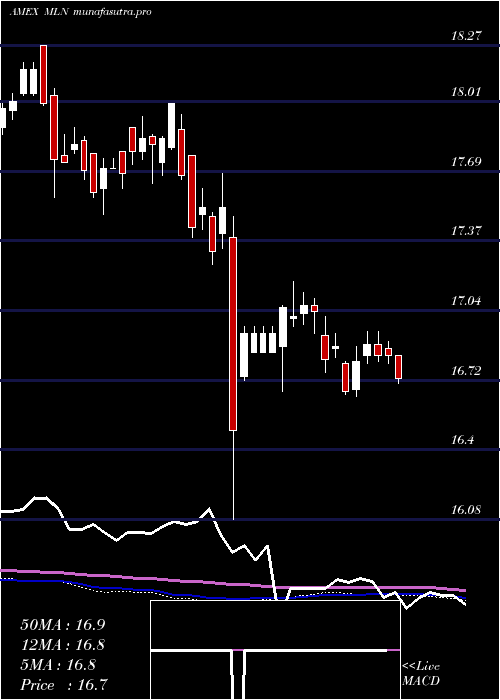
Weekly price and volumes for Long Municipal
| Date |
Closing |
Open |
Range |
Volume |
Fri 24 October 2025 |
17.76 (0.17%) |
17.73 |
17.68 - 17.77 |
1.1133 times |
Fri 17 October 2025 |
17.73 (1.43%) |
17.57 |
17.54 - 17.73 |
1.1128 times |
Tue 07 October 2025 |
17.48 (0.06%) |
17.44 |
17.42 - 17.49 |
0.6686 times |
Fri 03 October 2025 |
17.47 (0.34%) |
17.44 |
17.43 - 17.50 |
1.0472 times |
Fri 26 September 2025 |
17.41 (-0.34%) |
17.47 |
17.38 - 17.49 |
0.8747 times |
Fri 19 September 2025 |
17.47 (0.46%) |
17.47 |
17.42 - 17.58 |
1.0992 times |
Fri 12 September 2025 |
17.39 (1.93%) |
17.09 |
17.09 - 17.43 |
1.9789 times |
Fri 05 September 2025 |
17.06 (1.19%) |
16.77 |
16.72 - 17.06 |
0.7053 times |
Fri 29 August 2025 |
16.86 (0%) |
16.84 |
16.83 - 16.87 |
0.2098 times |
Fri 29 August 2025 |
16.86 (0.36%) |
16.79 |
16.78 - 16.87 |
1.1903 times |
Fri 22 August 2025 |
16.80 (0.12%) |
16.77 |
16.72 - 16.82 |
1.6099 times |
Monthly price and charts LongMunicipal Strong monthly Stock price targets for LongMunicipal MLN are 17.59 and 17.94 | Monthly Target 1 | 17.3 | | Monthly Target 2 | 17.53 | | Monthly Target 3 | 17.65 | | Monthly Target 4 | 17.88 | | Monthly Target 5 | 18 |
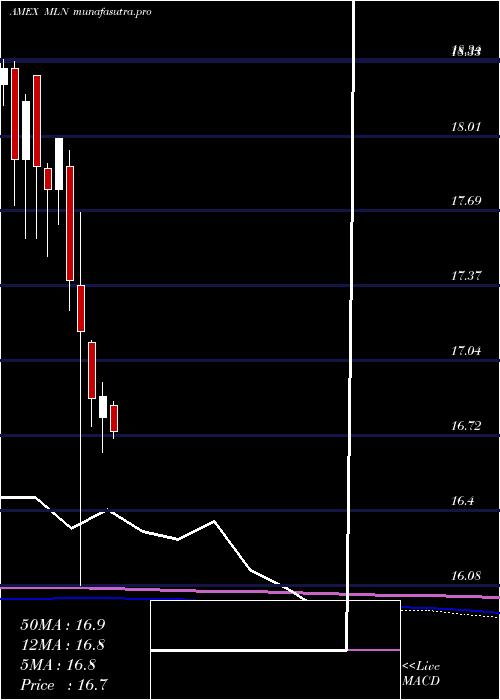
Monthly price and volumes Long Municipal
| Date |
Closing |
Open |
Range |
Volume |
Fri 24 October 2025 |
17.76 (1.6%) |
17.47 |
17.42 - 17.77 |
0.6471 times |
Tue 30 September 2025 |
17.48 (3.68%) |
16.77 |
16.72 - 17.58 |
0.887 times |
Fri 29 August 2025 |
16.86 (1.38%) |
16.72 |
16.72 - 16.87 |
1.0654 times |
Thu 31 July 2025 |
16.63 (-1.54%) |
16.85 |
16.51 - 16.87 |
1.1332 times |
Mon 30 June 2025 |
16.89 (0.06%) |
16.80 |
16.65 - 16.95 |
1.4198 times |
Fri 30 May 2025 |
16.88 (-1.69%) |
17.12 |
16.76 - 17.13 |
1.0585 times |
Wed 30 April 2025 |
17.17 (-1.27%) |
17.37 |
16.08 - 17.68 |
1.7928 times |
Mon 31 March 2025 |
17.39 (-3.39%) |
17.88 |
17.26 - 17.95 |
0.8542 times |
Fri 28 February 2025 |
18.00 (1.24%) |
17.78 |
17.63 - 18.00 |
0.492 times |
Fri 31 January 2025 |
17.78 (-0.56%) |
17.87 |
17.49 - 17.89 |
0.6499 times |
Tue 31 December 2024 |
17.88 (-1.54%) |
18.27 |
17.57 - 18.27 |
0.6911 times |
DMA SMA EMA moving averages of Long Municipal MLN
DMA (daily moving average) of Long Municipal MLN
| DMA period | DMA value | | 5 day DMA | 17.74 | | 12 day DMA | 17.66 | | 20 day DMA | 17.58 | | 35 day DMA | 17.46 | | 50 day DMA | 17.26 | | 100 day DMA | 17.01 | | 150 day DMA | 17.02 | | 200 day DMA | 17.2 | EMA (exponential moving average) of Long Municipal MLN
| EMA period | EMA current | EMA prev | EMA prev2 | | 5 day EMA | 17.73 | 17.71 | 17.71 | | 12 day EMA | 17.67 | 17.65 | 17.64 | | 20 day EMA | 17.59 | 17.57 | 17.55 | | 35 day EMA | 17.42 | 17.4 | 17.38 | | 50 day EMA | 17.27 | 17.25 | 17.23 |
SMA (simple moving average) of Long Municipal MLN
| SMA period | SMA current | SMA prev | SMA prev2 | | 5 day SMA | 17.74 | 17.73 | 17.73 | | 12 day SMA | 17.66 | 17.64 | 17.62 | | 20 day SMA | 17.58 | 17.56 | 17.55 | | 35 day SMA | 17.46 | 17.43 | 17.4 | | 50 day SMA | 17.26 | 17.24 | 17.22 | | 100 day SMA | 17.01 | 17 | 16.99 | | 150 day SMA | 17.02 | 17.02 | 17.02 | | 200 day SMA | 17.2 | 17.2 | 17.2 |
|
|
