AmericanCentury MID full analysis,charts,indicators,moving averages,SMA,DMA,EMA,ADX,MACD,RSIAmerican Century MID WideScreen charts, DMA,SMA,EMA technical analysis, forecast prediction, by indicators ADX,MACD,RSI,CCI AMEX stock exchange
Daily price and charts and targets AmericanCentury Strong Daily Stock price targets for AmericanCentury MID are 68.9 and 68.9 | Daily Target 1 | 68.9 | | Daily Target 2 | 68.9 | | Daily Target 3 | 68.9 | | Daily Target 4 | 68.9 | | Daily Target 5 | 68.9 |
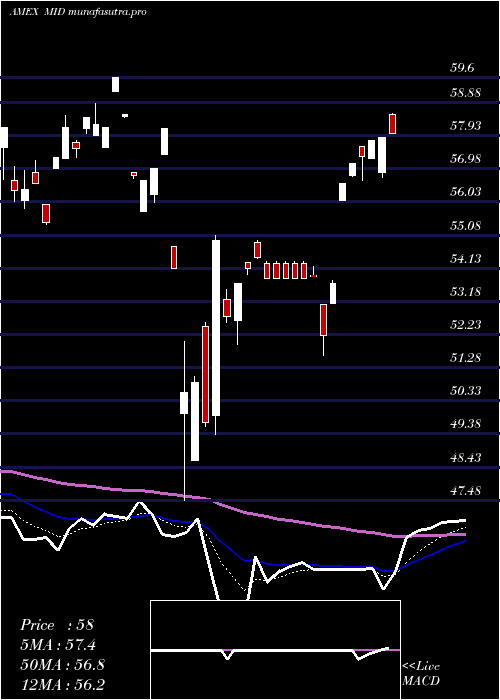
Daily price and volume American Century
| Date |
Closing |
Open |
Range |
Volume |
Fri 24 October 2025 |
68.90 (2.99%) |
68.90 |
68.90 - 68.90 |
0.2504 times |
Thu 23 October 2025 |
66.90 (0%) |
68.28 |
68.28 - 68.28 |
0 times |
Wed 22 October 2025 |
66.90 (-1.34%) |
66.69 |
66.69 - 66.96 |
0.4475 times |
Tue 21 October 2025 |
67.81 (0.76%) |
67.87 |
67.80 - 67.87 |
0.6259 times |
Mon 20 October 2025 |
67.30 (1.31%) |
67.12 |
67.09 - 67.30 |
2.4798 times |
Fri 17 October 2025 |
66.43 (-0.11%) |
66.43 |
66.21 - 66.43 |
1.4727 times |
Thu 16 October 2025 |
66.50 (-0.43%) |
66.44 |
66.44 - 66.50 |
0.1546 times |
Wed 15 October 2025 |
66.79 (0.13%) |
67.09 |
66.79 - 67.22 |
0.6259 times |
Tue 14 October 2025 |
66.70 (0.48%) |
66.18 |
66.18 - 67.01 |
1.377 times |
Mon 13 October 2025 |
66.38 (1.75%) |
65.61 |
65.61 - 66.58 |
2.5662 times |
Fri 10 October 2025 |
65.24 (-2.95%) |
67.30 |
65.24 - 67.30 |
1.9403 times |
Weekly price and charts AmericanCentury Strong weekly Stock price targets for AmericanCentury MID are 67.8 and 70.01 | Weekly Target 1 | 65.95 | | Weekly Target 2 | 67.43 | | Weekly Target 3 | 68.163333333333 | | Weekly Target 4 | 69.64 | | Weekly Target 5 | 70.37 |
Weekly price and volumes for American Century
| Date |
Closing |
Open |
Range |
Volume |
Fri 24 October 2025 |
68.90 (3.72%) |
67.12 |
66.69 - 68.90 |
0.6547 times |
Fri 17 October 2025 |
66.43 (1.82%) |
65.61 |
65.61 - 67.22 |
1.0665 times |
Fri 10 October 2025 |
65.24 (-2.25%) |
67.24 |
65.24 - 67.44 |
1.3395 times |
Fri 03 October 2025 |
66.74 (0.39%) |
67.45 |
65.96 - 67.45 |
0.7451 times |
Fri 26 September 2025 |
66.48 (-2.56%) |
68.63 |
66.14 - 68.63 |
1.5189 times |
Fri 19 September 2025 |
68.23 (1.13%) |
67.83 |
67.26 - 68.35 |
1.422 times |
Fri 12 September 2025 |
67.47 (0.25%) |
67.55 |
66.70 - 68.05 |
0.7433 times |
Fri 05 September 2025 |
67.30 (0.37%) |
66.08 |
65.78 - 67.30 |
1.1419 times |
Fri 29 August 2025 |
67.05 (0%) |
67.18 |
67.05 - 67.18 |
0.097 times |
Fri 29 August 2025 |
67.05 (-0.46%) |
66.98 |
66.81 - 67.81 |
1.2712 times |
Fri 22 August 2025 |
67.36 (1.17%) |
67.02 |
65.82 - 67.58 |
1.0234 times |

Monthly price and charts AmericanCentury Strong monthly Stock price targets for AmericanCentury MID are 67.07 and 70.73 | Monthly Target 1 | 64.02 | | Monthly Target 2 | 66.46 | | Monthly Target 3 | 67.68 | | Monthly Target 4 | 70.12 | | Monthly Target 5 | 71.34 |
Monthly price and volumes American Century
| Date |
Closing |
Open |
Range |
Volume |
Fri 24 October 2025 |
68.90 (3.73%) |
66.18 |
65.24 - 68.90 |
0.5071 times |
Tue 30 September 2025 |
66.42 (-0.94%) |
66.08 |
65.78 - 68.63 |
0.7538 times |
Fri 29 August 2025 |
67.05 (1.56%) |
65.09 |
65.09 - 67.81 |
0.7176 times |
Thu 31 July 2025 |
66.02 (-0.03%) |
66.06 |
64.65 - 67.03 |
0.839 times |
Mon 30 June 2025 |
66.04 (4.51%) |
63.29 |
62.58 - 66.13 |
1.1235 times |
Fri 30 May 2025 |
63.19 (9.19%) |
58.52 |
57.98 - 63.77 |
1.037 times |
Wed 30 April 2025 |
57.87 (2.15%) |
56.24 |
47.48 - 58.13 |
1.4201 times |
Mon 31 March 2025 |
56.65 (-6.39%) |
60.75 |
55.39 - 60.75 |
1.142 times |
Fri 28 February 2025 |
60.52 (-5.5%) |
63.04 |
59.67 - 65.12 |
1.1833 times |
Fri 31 January 2025 |
64.04 (6.17%) |
60.81 |
60.23 - 65.36 |
1.2765 times |
Tue 31 December 2024 |
60.32 (-6.19%) |
64.19 |
60.12 - 65.56 |
1.1431 times |

DMA SMA EMA moving averages of American Century MID
DMA (daily moving average) of American Century MID
| DMA period | DMA value | | 5 day DMA | 67.56 | | 12 day DMA | 66.92 | | 20 day DMA | 66.85 | | 35 day DMA | 67.13 | | 50 day DMA | 67.07 | | 100 day DMA | 66.32 | | 150 day DMA | 63.53 | | 200 day DMA | 63.06 | EMA (exponential moving average) of American Century MID
| EMA period | EMA current | EMA prev | EMA prev2 | | 5 day EMA | 67.63 | 67 | 67.05 | | 12 day EMA | 67.2 | 66.89 | 66.89 | | 20 day EMA | 67.08 | 66.89 | 66.89 | | 35 day EMA | 67.01 | 66.9 | 66.9 | | 50 day EMA | 67.08 | 67.01 | 67.01 |
SMA (simple moving average) of American Century MID
| SMA period | SMA current | SMA prev | SMA prev2 | | 5 day SMA | 67.56 | 67.07 | 66.99 | | 12 day SMA | 66.92 | 66.8 | 66.75 | | 20 day SMA | 66.85 | 66.73 | 66.69 | | 35 day SMA | 67.13 | 67.09 | 67.09 | | 50 day SMA | 67.07 | 67.02 | 67.01 | | 100 day SMA | 66.32 | 66.27 | 66.23 | | 150 day SMA | 63.53 | 63.46 | 63.4 | | 200 day SMA | 63.06 | 63.03 | 63 |
|
|
