MastechHoldings MHH full analysis,charts,indicators,moving averages,SMA,DMA,EMA,ADX,MACD,RSIMastech Holdings MHH WideScreen charts, DMA,SMA,EMA technical analysis, forecast prediction, by indicators ADX,MACD,RSI,CCI AMEX stock exchange
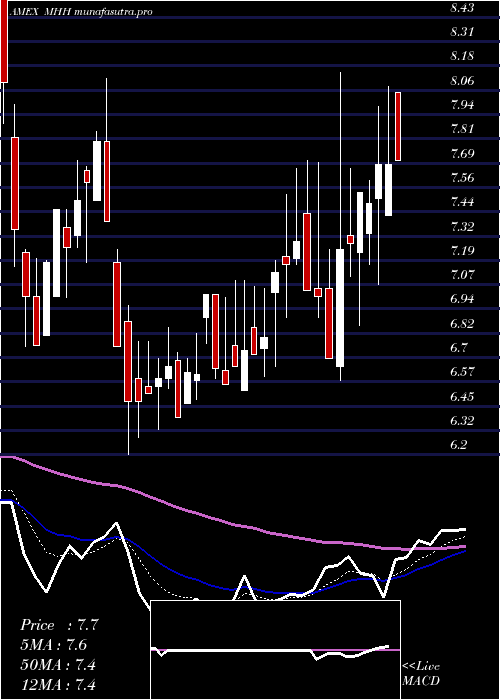
Daily price and charts and targets MastechHoldings Strong Daily Stock price targets for MastechHoldings MHH are 6.63 and 7.06 | Daily Target 1 | 6.52 | | Daily Target 2 | 6.73 | | Daily Target 3 | 6.9466666666667 | | Daily Target 4 | 7.16 | | Daily Target 5 | 7.38 |
Daily price and volume Mastech Holdings
| Date |
Closing |
Open |
Range |
Volume |
Thu 23 October 2025 |
6.95 (2.81%) |
6.96 |
6.73 - 7.16 |
1.0382 times |
Wed 22 October 2025 |
6.76 (-0.59%) |
6.71 |
6.59 - 7.08 |
0.5682 times |
Tue 21 October 2025 |
6.80 (2.26%) |
6.83 |
6.63 - 6.85 |
1.388 times |
Mon 20 October 2025 |
6.65 (-0.89%) |
6.89 |
6.63 - 7.06 |
0.464 times |
Fri 17 October 2025 |
6.71 (-4.55%) |
6.92 |
6.68 - 7.01 |
1.1518 times |
Thu 16 October 2025 |
7.03 (-1.95%) |
6.92 |
6.92 - 7.12 |
0.886 times |
Wed 15 October 2025 |
7.17 (2.72%) |
7.07 |
7.01 - 7.19 |
1.2551 times |
Tue 14 October 2025 |
6.98 (-0.71%) |
7.20 |
6.98 - 7.23 |
1.0632 times |
Mon 13 October 2025 |
7.03 (-4.87%) |
7.55 |
7.03 - 7.55 |
1.2256 times |
Tue 07 October 2025 |
7.39 (-0.4%) |
7.40 |
7.32 - 7.45 |
0.9598 times |
Mon 06 October 2025 |
7.42 (-0.67%) |
7.35 |
7.32 - 7.54 |
2.0239 times |
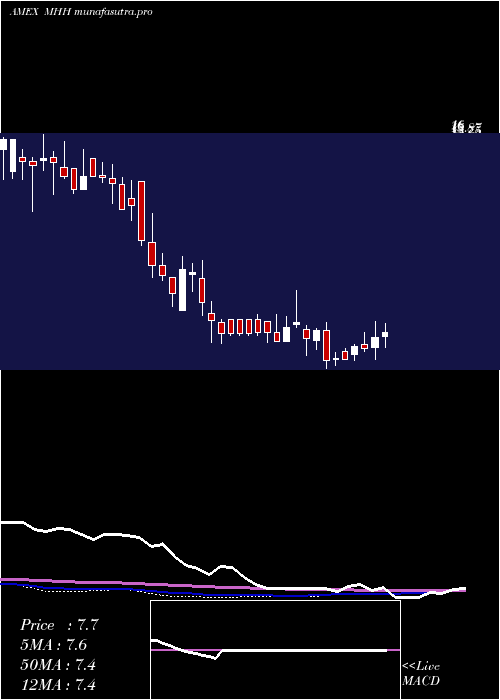
Weekly price and charts MastechHoldings Strong weekly Stock price targets for MastechHoldings MHH are 6.77 and 7.34 | Weekly Target 1 | 6.33 | | Weekly Target 2 | 6.64 | | Weekly Target 3 | 6.9 | | Weekly Target 4 | 7.21 | | Weekly Target 5 | 7.47 |
Weekly price and volumes for Mastech Holdings
| Date |
Closing |
Open |
Range |
Volume |
Thu 23 October 2025 |
6.95 (3.58%) |
6.89 |
6.59 - 7.16 |
0.5821 times |
Fri 17 October 2025 |
6.71 (-9.2%) |
7.55 |
6.68 - 7.55 |
0.9394 times |
Tue 07 October 2025 |
7.39 (-1.07%) |
7.35 |
7.32 - 7.54 |
0.5022 times |
Fri 03 October 2025 |
7.47 (-3.98%) |
7.75 |
7.33 - 7.88 |
1.5571 times |
Fri 26 September 2025 |
7.78 (-0.89%) |
7.89 |
7.48 - 7.90 |
0.4921 times |
Fri 19 September 2025 |
7.85 (4.67%) |
7.74 |
7.39 - 7.90 |
1.0637 times |
Fri 12 September 2025 |
7.50 (-6.13%) |
7.82 |
7.36 - 7.98 |
1.9931 times |
Fri 05 September 2025 |
7.99 (-1.24%) |
8.13 |
7.80 - 8.20 |
0.9121 times |
Fri 29 August 2025 |
8.09 (0%) |
7.51 |
7.22 - 8.10 |
0.4995 times |
Fri 29 August 2025 |
8.09 (9.03%) |
7.14 |
7.14 - 8.10 |
1.4588 times |
Fri 22 August 2025 |
7.42 (-3.76%) |
7.77 |
7.21 - 8.15 |
0.8151 times |
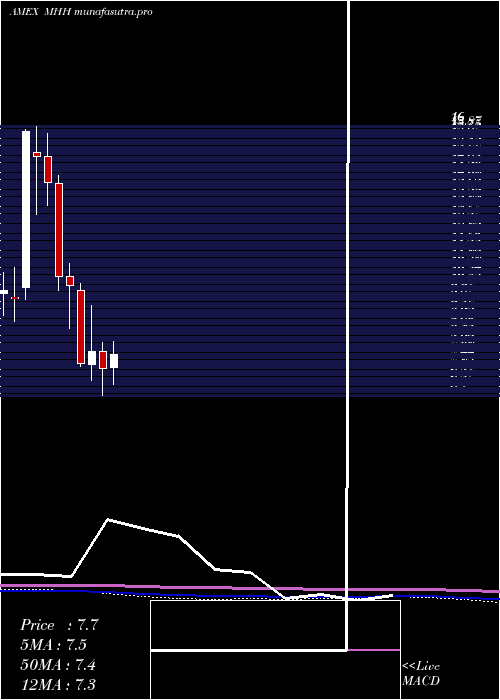
Monthly price and charts MastechHoldings Strong monthly Stock price targets for MastechHoldings MHH are 6.18 and 7.36 | Monthly Target 1 | 5.92 | | Monthly Target 2 | 6.44 | | Monthly Target 3 | 7.1033333333333 | | Monthly Target 4 | 7.62 | | Monthly Target 5 | 8.28 |
Monthly price and volumes Mastech Holdings
| Date |
Closing |
Open |
Range |
Volume |
Thu 23 October 2025 |
6.95 (-8.79%) |
7.62 |
6.59 - 7.77 |
0.3408 times |
Tue 30 September 2025 |
7.62 (-5.81%) |
8.13 |
7.36 - 8.20 |
0.5954 times |
Fri 29 August 2025 |
8.09 (12.05%) |
7.16 |
7.10 - 8.15 |
0.5248 times |
Thu 31 July 2025 |
7.22 (0.7%) |
7.20 |
6.58 - 8.37 |
1.2307 times |
Mon 30 June 2025 |
7.17 (-8.08%) |
7.80 |
6.20 - 8.12 |
0.8072 times |
Fri 30 May 2025 |
7.80 (5.98%) |
7.32 |
6.75 - 9.48 |
1.2789 times |
Wed 30 April 2025 |
7.36 (-27.91%) |
10.02 |
7.25 - 10.26 |
0.924 times |
Mon 31 March 2025 |
10.21 (-3.04%) |
10.53 |
8.63 - 11.00 |
1.1875 times |
Fri 28 February 2025 |
10.53 (-24.62%) |
13.93 |
10.01 - 14.23 |
1.4925 times |
Fri 31 January 2025 |
13.97 (-6.24%) |
14.90 |
13.11 - 15.74 |
1.6182 times |
Tue 31 December 2024 |
14.90 (-5.82%) |
15.04 |
12.80 - 16.00 |
1.5851 times |
DMA SMA EMA moving averages of Mastech Holdings MHH
DMA (daily moving average) of Mastech Holdings MHH
| DMA period | DMA value | | 5 day DMA | 6.77 | | 12 day DMA | 7.03 | | 20 day DMA | 7.27 | | 35 day DMA | 7.47 | | 50 day DMA | 7.5 | | 100 day DMA | 7.37 | | 150 day DMA | 7.66 | | 200 day DMA | 8.9 | EMA (exponential moving average) of Mastech Holdings MHH
| EMA period | EMA current | EMA prev | EMA prev2 | | 5 day EMA | 6.86 | 6.82 | 6.85 | | 12 day EMA | 7.01 | 7.02 | 7.07 | | 20 day EMA | 7.17 | 7.19 | 7.23 | | 35 day EMA | 7.32 | 7.34 | 7.37 | | 50 day EMA | 7.42 | 7.44 | 7.47 |
SMA (simple moving average) of Mastech Holdings MHH
| SMA period | SMA current | SMA prev | SMA prev2 | | 5 day SMA | 6.77 | 6.79 | 6.87 | | 12 day SMA | 7.03 | 7.07 | 7.12 | | 20 day SMA | 7.27 | 7.31 | 7.37 | | 35 day SMA | 7.47 | 7.5 | 7.54 | | 50 day SMA | 7.5 | 7.51 | 7.53 | | 100 day SMA | 7.37 | 7.37 | 7.38 | | 150 day SMA | 7.66 | 7.68 | 7.69 | | 200 day SMA | 8.9 | 8.94 | 8.98 |
|
|
