PimcoRafi MFEM full analysis,charts,indicators,moving averages,SMA,DMA,EMA,ADX,MACD,RSIPimco Rafi MFEM WideScreen charts, DMA,SMA,EMA technical analysis, forecast prediction, by indicators ADX,MACD,RSI,CCI AMEX stock exchange
Daily price and charts and targets PimcoRafi Strong Daily Stock price targets for PimcoRafi MFEM are 22.67 and 22.76 | Daily Target 1 | 22.6 | | Daily Target 2 | 22.64 | | Daily Target 3 | 22.686666666667 | | Daily Target 4 | 22.73 | | Daily Target 5 | 22.78 |
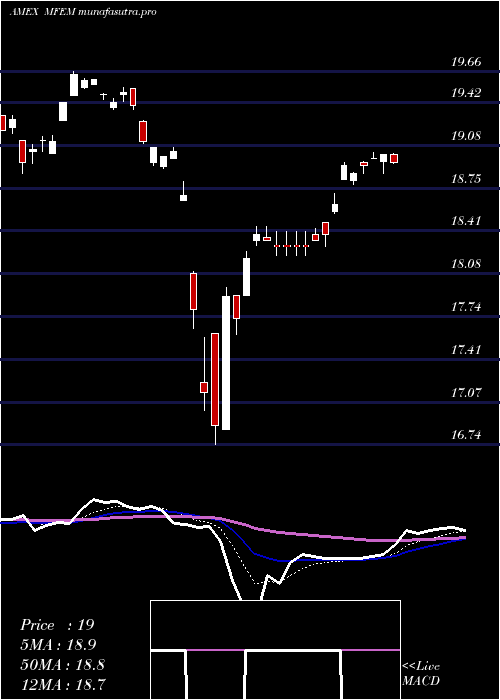
Daily price and volume Pimco Rafi
| Date |
Closing |
Open |
Range |
Volume |
Thu 23 October 2025 |
22.69 (0.67%) |
22.66 |
22.64 - 22.73 |
0.7188 times |
Wed 22 October 2025 |
22.54 (0.54%) |
22.56 |
22.44 - 22.63 |
1.1501 times |
Tue 21 October 2025 |
22.42 (-1.23%) |
22.55 |
22.42 - 22.55 |
1.0829 times |
Mon 20 October 2025 |
22.70 (1.02%) |
22.61 |
22.61 - 22.70 |
0.3683 times |
Fri 17 October 2025 |
22.47 (-0.22%) |
22.42 |
22.37 - 22.49 |
0.6114 times |
Thu 16 October 2025 |
22.52 (1.08%) |
22.50 |
22.44 - 22.61 |
1.3666 times |
Wed 15 October 2025 |
22.28 (1.27%) |
22.27 |
22.21 - 22.31 |
1.1103 times |
Tue 14 October 2025 |
22.00 (-0.41%) |
21.89 |
21.83 - 22.10 |
1.0418 times |
Mon 13 October 2025 |
22.09 (2.65%) |
22.11 |
22.03 - 22.13 |
1.0418 times |
Fri 10 October 2025 |
21.52 (-3.19%) |
22.25 |
21.46 - 22.27 |
1.5079 times |
Thu 09 October 2025 |
22.23 (-0.63%) |
22.48 |
22.22 - 22.48 |
1.316 times |
Weekly price and charts PimcoRafi Strong weekly Stock price targets for PimcoRafi MFEM are 22.56 and 22.87 | Weekly Target 1 | 22.3 | | Weekly Target 2 | 22.5 | | Weekly Target 3 | 22.613333333333 | | Weekly Target 4 | 22.81 | | Weekly Target 5 | 22.92 |
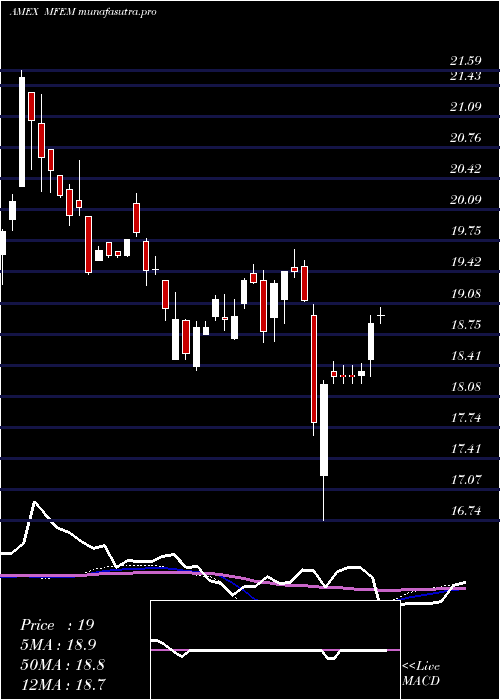
Weekly price and volumes for Pimco Rafi
| Date |
Closing |
Open |
Range |
Volume |
Thu 23 October 2025 |
22.69 (0.98%) |
22.61 |
22.42 - 22.73 |
0.2495 times |
Fri 17 October 2025 |
22.47 (4.41%) |
22.11 |
21.83 - 22.61 |
0.3887 times |
Fri 10 October 2025 |
21.52 (-3.93%) |
22.41 |
21.46 - 22.49 |
0.8367 times |
Fri 03 October 2025 |
22.40 (0.58%) |
22.51 |
22.20 - 22.55 |
0.9236 times |
Fri 26 September 2025 |
22.27 (-1.42%) |
22.59 |
22.17 - 22.76 |
1.4548 times |
Fri 19 September 2025 |
22.59 (0.71%) |
22.54 |
22.49 - 22.85 |
3.7049 times |
Fri 12 September 2025 |
22.43 (2.94%) |
21.93 |
21.89 - 22.48 |
1.5166 times |
Fri 05 September 2025 |
21.79 (0.69%) |
21.44 |
21.44 - 21.84 |
0.2164 times |
Fri 29 August 2025 |
21.64 (0%) |
21.66 |
21.58 - 21.68 |
0.1772 times |
Fri 29 August 2025 |
21.64 (-1.59%) |
21.96 |
21.58 - 22.00 |
0.5316 times |
Fri 22 August 2025 |
21.99 (1.29%) |
21.72 |
21.58 - 22.01 |
0.6769 times |
Monthly price and charts PimcoRafi Strong monthly Stock price targets for PimcoRafi MFEM are 22.08 and 23.35 | Monthly Target 1 | 21.02 | | Monthly Target 2 | 21.86 | | Monthly Target 3 | 22.293333333333 | | Monthly Target 4 | 23.13 | | Monthly Target 5 | 23.56 |
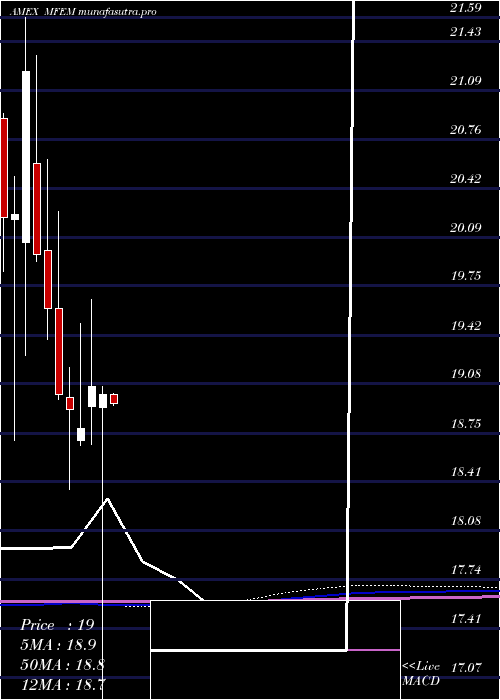
Monthly price and volumes Pimco Rafi
| Date |
Closing |
Open |
Range |
Volume |
Thu 23 October 2025 |
22.69 (0.75%) |
22.40 |
21.46 - 22.73 |
0.5625 times |
Tue 30 September 2025 |
22.52 (4.07%) |
21.44 |
21.44 - 22.85 |
2.1734 times |
Fri 29 August 2025 |
21.64 (2.71%) |
20.94 |
20.93 - 22.01 |
0.5509 times |
Thu 31 July 2025 |
21.07 (-0.43%) |
21.05 |
20.21 - 21.78 |
0.4461 times |
Mon 30 June 2025 |
21.16 (6.28%) |
19.93 |
19.91 - 21.24 |
0.4639 times |
Fri 30 May 2025 |
19.91 (4.73%) |
19.01 |
18.94 - 20.22 |
0.8376 times |
Wed 30 April 2025 |
19.01 (-0.31%) |
18.92 |
16.74 - 19.07 |
0.9417 times |
Mon 31 March 2025 |
19.07 (1.54%) |
18.93 |
18.67 - 19.66 |
1.3677 times |
Fri 28 February 2025 |
18.78 (-0.69%) |
18.70 |
18.66 - 19.50 |
0.7315 times |
Fri 31 January 2025 |
18.91 (-0.53%) |
18.99 |
18.36 - 19.20 |
1.9247 times |
Tue 31 December 2024 |
19.01 (-3.01%) |
19.60 |
18.98 - 20.26 |
0.7493 times |
DMA SMA EMA moving averages of Pimco Rafi MFEM
DMA (daily moving average) of Pimco Rafi MFEM
| DMA period | DMA value | | 5 day DMA | 22.56 | | 12 day DMA | 22.32 | | 20 day DMA | 22.35 | | 35 day DMA | 22.38 | | 50 day DMA | 22.18 | | 100 day DMA | 21.65 | | 150 day DMA | 20.79 | | 200 day DMA | 20.36 | EMA (exponential moving average) of Pimco Rafi MFEM
| EMA period | EMA current | EMA prev | EMA prev2 | | 5 day EMA | 22.54 | 22.47 | 22.44 | | 12 day EMA | 22.43 | 22.38 | 22.35 | | 20 day EMA | 22.38 | 22.35 | 22.33 | | 35 day EMA | 22.26 | 22.23 | 22.21 | | 50 day EMA | 22.17 | 22.15 | 22.13 |
SMA (simple moving average) of Pimco Rafi MFEM
| SMA period | SMA current | SMA prev | SMA prev2 | | 5 day SMA | 22.56 | 22.53 | 22.48 | | 12 day SMA | 22.32 | 22.29 | 22.28 | | 20 day SMA | 22.35 | 22.33 | 22.32 | | 35 day SMA | 22.38 | 22.34 | 22.32 | | 50 day SMA | 22.18 | 22.16 | 22.15 | | 100 day SMA | 21.65 | 21.62 | 21.59 | | 150 day SMA | 20.79 | 20.77 | 20.75 | | 200 day SMA | 20.36 | 20.34 | 20.32 |
|
|
