SpdrS MDY full analysis,charts,indicators,moving averages,SMA,DMA,EMA,ADX,MACD,RSISpdr S MDY WideScreen charts, DMA,SMA,EMA technical analysis, forecast prediction, by indicators ADX,MACD,RSI,CCI AMEX stock exchange
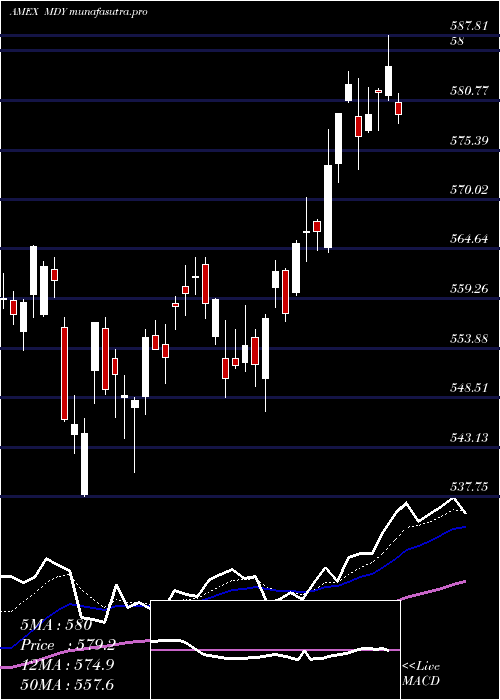
Daily price and charts and targets SpdrS Strong Daily Stock price targets for SpdrS MDY are 601.71 and 606.89 | Daily Target 1 | 598 | | Daily Target 2 | 600.24 | | Daily Target 3 | 603.18 | | Daily Target 4 | 605.42 | | Daily Target 5 | 608.36 |
Daily price and volume Spdr S
| Date |
Closing |
Open |
Range |
Volume |
Fri 24 October 2025 |
602.48 (0.53%) |
600.94 |
600.94 - 606.12 |
0.5734 times |
Thu 23 October 2025 |
599.29 (1.36%) |
593.36 |
592.33 - 600.23 |
0.6777 times |
Wed 22 October 2025 |
591.27 (-1.13%) |
597.34 |
588.66 - 599.37 |
0.9217 times |
Tue 21 October 2025 |
598.05 (0.35%) |
595.47 |
593.49 - 599.99 |
0.8858 times |
Mon 20 October 2025 |
595.94 (1.2%) |
593.64 |
592.62 - 596.67 |
0.5885 times |
Fri 17 October 2025 |
588.86 (0.21%) |
586.11 |
584.67 - 590.05 |
0.6054 times |
Thu 16 October 2025 |
587.61 (-1.23%) |
596.32 |
584.77 - 596.34 |
1.6521 times |
Wed 15 October 2025 |
594.92 (0.09%) |
598.45 |
590.00 - 600.94 |
0.9267 times |
Tue 14 October 2025 |
594.38 (0.93%) |
582.70 |
582.70 - 597.43 |
1.6521 times |
Mon 13 October 2025 |
588.92 (1.93%) |
584.87 |
584.12 - 590.98 |
1.5164 times |
Fri 10 October 2025 |
577.77 (-2.8%) |
595.25 |
577.15 - 596.66 |
1.7522 times |
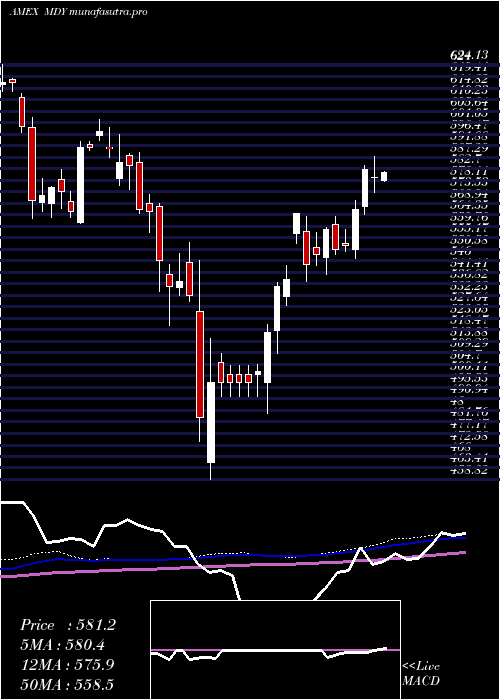
Weekly price and charts SpdrS Strong weekly Stock price targets for SpdrS MDY are 595.57 and 613.03 | Weekly Target 1 | 581.63 | | Weekly Target 2 | 592.05 | | Weekly Target 3 | 599.08666666667 | | Weekly Target 4 | 609.51 | | Weekly Target 5 | 616.55 |
Weekly price and volumes for Spdr S
| Date |
Closing |
Open |
Range |
Volume |
Fri 24 October 2025 |
602.48 (2.31%) |
593.64 |
588.66 - 606.12 |
0.7001 times |
Fri 17 October 2025 |
588.86 (1.92%) |
584.87 |
582.70 - 600.94 |
1.2194 times |
Fri 10 October 2025 |
577.77 (-3.81%) |
603.75 |
577.15 - 604.60 |
1.4075 times |
Fri 03 October 2025 |
600.68 (0.67%) |
598.97 |
590.78 - 604.20 |
0.885 times |
Fri 26 September 2025 |
596.68 (-0.46%) |
597.67 |
587.14 - 604.65 |
0.9691 times |
Fri 19 September 2025 |
599.42 (-0.2%) |
601.58 |
593.71 - 608.79 |
1.2814 times |
Fri 12 September 2025 |
600.62 (-0.38%) |
603.45 |
595.08 - 607.54 |
1.1734 times |
Fri 05 September 2025 |
602.89 (1.3%) |
588.64 |
587.48 - 607.85 |
0.7272 times |
Fri 29 August 2025 |
595.16 (0%) |
598.31 |
593.03 - 599.10 |
0.2613 times |
Fri 29 August 2025 |
595.16 (-0.07%) |
594.36 |
590.69 - 599.16 |
1.3756 times |
Fri 22 August 2025 |
595.56 (2.67%) |
580.50 |
575.91 - 597.91 |
1.1501 times |
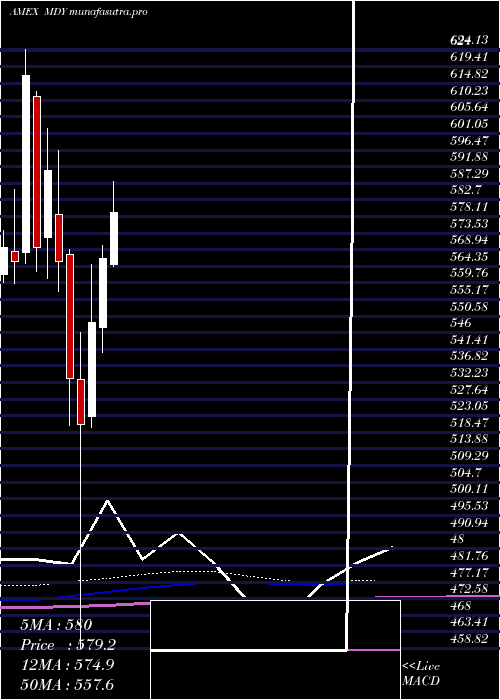
Monthly price and charts SpdrS Strong monthly Stock price targets for SpdrS MDY are 589.82 and 618.79 | Monthly Target 1 | 566.28 | | Monthly Target 2 | 584.38 | | Monthly Target 3 | 595.25 | | Monthly Target 4 | 613.35 | | Monthly Target 5 | 624.22 |
Monthly price and volumes Spdr S
| Date |
Closing |
Open |
Range |
Volume |
Fri 24 October 2025 |
602.48 (1.08%) |
593.43 |
577.15 - 606.12 |
0.6904 times |
Tue 30 September 2025 |
596.03 (0.15%) |
588.64 |
587.14 - 608.79 |
0.8205 times |
Fri 29 August 2025 |
595.16 (3.39%) |
568.18 |
559.89 - 599.16 |
0.8549 times |
Thu 31 July 2025 |
575.62 (1.61%) |
564.77 |
564.32 - 589.45 |
0.8004 times |
Mon 30 June 2025 |
566.48 (3.24%) |
547.50 |
540.43 - 570.21 |
0.8098 times |
Fri 30 May 2025 |
548.72 (5.36%) |
522.90 |
519.78 - 564.98 |
0.8917 times |
Wed 30 April 2025 |
520.80 (-2.38%) |
532.95 |
458.82 - 546.07 |
2.0182 times |
Mon 31 March 2025 |
533.48 (-5.71%) |
567.57 |
520.28 - 569.00 |
1.1283 times |
Fri 28 February 2025 |
565.80 (-4.21%) |
578.73 |
557.43 - 596.30 |
0.9576 times |
Fri 31 January 2025 |
590.68 (3.7%) |
572.43 |
560.89 - 602.32 |
1.0282 times |
Tue 31 December 2024 |
569.58 (-7.67%) |
611.30 |
562.80 - 612.54 |
0.7849 times |
DMA SMA EMA moving averages of Spdr S MDY
DMA (daily moving average) of Spdr S MDY
| DMA period | DMA value | | 5 day DMA | 597.41 | | 12 day DMA | 592.83 | | 20 day DMA | 595.02 | | 35 day DMA | 596.79 | | 50 day DMA | 595.28 | | 100 day DMA | 583.38 | | 150 day DMA | 564.38 | | 200 day DMA | 565.94 | EMA (exponential moving average) of Spdr S MDY
| EMA period | EMA current | EMA prev | EMA prev2 | | 5 day EMA | 597.64 | 595.22 | 593.18 | | 12 day EMA | 595.52 | 594.26 | 593.35 | | 20 day EMA | 595.19 | 594.42 | 593.91 | | 35 day EMA | 594.41 | 593.94 | 593.63 | | 50 day EMA | 594.35 | 594.02 | 593.8 |
SMA (simple moving average) of Spdr S MDY
| SMA period | SMA current | SMA prev | SMA prev2 | | 5 day SMA | 597.41 | 594.68 | 592.35 | | 12 day SMA | 592.83 | 592.7 | 592.35 | | 20 day SMA | 595.02 | 594.73 | 594.3 | | 35 day SMA | 596.79 | 596.8 | 596.83 | | 50 day SMA | 595.28 | 594.83 | 594.51 | | 100 day SMA | 583.38 | 582.84 | 582.33 | | 150 day SMA | 564.38 | 563.95 | 563.57 | | 200 day SMA | 565.94 | 565.8 | 565.67 |
|
|
