15Year LTPZ full analysis,charts,indicators,moving averages,SMA,DMA,EMA,ADX,MACD,RSI15 Year LTPZ WideScreen charts, DMA,SMA,EMA technical analysis, forecast prediction, by indicators ADX,MACD,RSI,CCI AMEX stock exchange
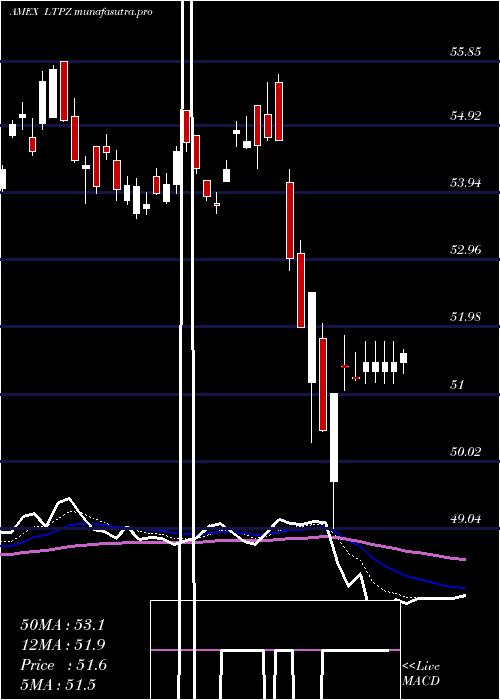
Daily price and charts and targets 15Year Strong Daily Stock price targets for 15Year LTPZ are 54.35 and 54.72 | Daily Target 1 | 54.05 | | Daily Target 2 | 54.27 | | Daily Target 3 | 54.42 | | Daily Target 4 | 54.64 | | Daily Target 5 | 54.79 |
Daily price and volume 15 Year
| Date |
Closing |
Open |
Range |
Volume |
Fri 24 October 2025 |
54.49 (0%) |
54.43 |
54.20 - 54.57 |
2.4653 times |
Thu 23 October 2025 |
54.49 (-0.58%) |
54.61 |
54.37 - 54.70 |
1.2846 times |
Wed 22 October 2025 |
54.81 (0.38%) |
54.67 |
54.58 - 54.82 |
1.1434 times |
Tue 21 October 2025 |
54.60 (0.66%) |
54.57 |
54.52 - 54.68 |
1.098 times |
Mon 20 October 2025 |
54.24 (0.43%) |
54.18 |
54.11 - 54.24 |
1.5251 times |
Fri 17 October 2025 |
54.01 (-0.44%) |
54.23 |
53.97 - 54.23 |
0.6644 times |
Thu 16 October 2025 |
54.25 (0.65%) |
53.83 |
53.83 - 54.31 |
0.511 times |
Wed 15 October 2025 |
53.90 (-0.13%) |
54.15 |
53.75 - 54.30 |
0.5146 times |
Tue 14 October 2025 |
53.97 (0.09%) |
53.89 |
53.84 - 54.04 |
0.4711 times |
Mon 13 October 2025 |
53.92 (1.39%) |
53.82 |
53.46 - 53.92 |
0.3225 times |
Tue 07 October 2025 |
53.18 (0.78%) |
52.97 |
52.97 - 53.31 |
0.5448 times |
Weekly price and charts 15Year Strong weekly Stock price targets for 15Year LTPZ are 54.3 and 55.01 | Weekly Target 1 | 53.76 | | Weekly Target 2 | 54.13 | | Weekly Target 3 | 54.473333333333 | | Weekly Target 4 | 54.84 | | Weekly Target 5 | 55.18 |
Weekly price and volumes for 15 Year
| Date |
Closing |
Open |
Range |
Volume |
Fri 24 October 2025 |
54.49 (0.89%) |
54.18 |
54.11 - 54.82 |
2.1294 times |
Fri 17 October 2025 |
54.01 (1.56%) |
53.82 |
53.46 - 54.31 |
0.7036 times |
Tue 07 October 2025 |
53.18 (0.06%) |
53.00 |
52.77 - 53.83 |
0.3156 times |
Fri 03 October 2025 |
53.15 (0.25%) |
53.25 |
53.07 - 53.52 |
0.9725 times |
Fri 26 September 2025 |
53.02 (-0.43%) |
53.02 |
52.83 - 53.34 |
1.3459 times |
Fri 19 September 2025 |
53.25 (-0.82%) |
53.69 |
53.05 - 54.40 |
1.501 times |
Fri 12 September 2025 |
53.69 (1.57%) |
53.07 |
52.97 - 53.93 |
1.2713 times |
Fri 05 September 2025 |
52.86 (1.87%) |
51.24 |
51.16 - 52.86 |
0.6598 times |
Fri 29 August 2025 |
51.89 (0%) |
52.04 |
51.79 - 52.09 |
0.1249 times |
Fri 29 August 2025 |
51.89 (-0.23%) |
51.83 |
51.53 - 52.26 |
0.976 times |
Fri 22 August 2025 |
52.01 (1.19%) |
51.40 |
51.00 - 52.19 |
1.3641 times |
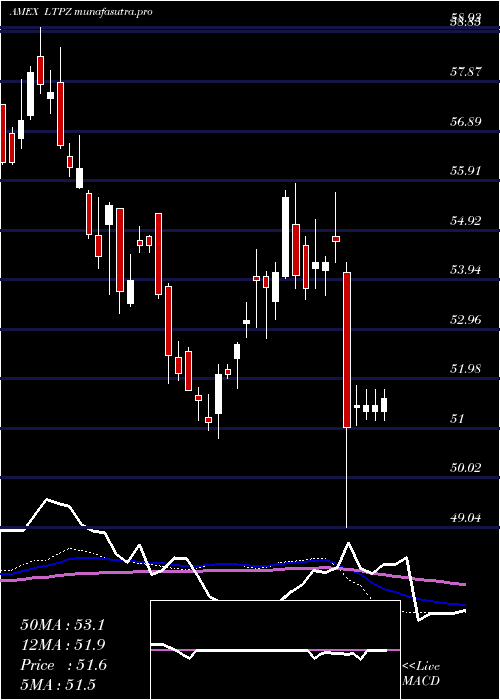
Monthly price and charts 15Year Strong monthly Stock price targets for 15Year LTPZ are 53.63 and 55.68 | Monthly Target 1 | 51.98 | | Monthly Target 2 | 53.23 | | Monthly Target 3 | 54.026666666667 | | Monthly Target 4 | 55.28 | | Monthly Target 5 | 56.08 |
Monthly price and volumes 15 Year
| Date |
Closing |
Open |
Range |
Volume |
Fri 24 October 2025 |
54.49 (2.27%) |
53.33 |
52.77 - 54.82 |
0.538 times |
Tue 30 September 2025 |
53.28 (2.68%) |
51.24 |
51.16 - 54.40 |
0.7276 times |
Fri 29 August 2025 |
51.89 (0.25%) |
51.89 |
51.00 - 52.49 |
0.6698 times |
Thu 31 July 2025 |
51.76 (-1.35%) |
52.35 |
50.61 - 52.42 |
0.7302 times |
Mon 30 June 2025 |
52.47 (1.65%) |
51.06 |
50.58 - 52.63 |
0.7521 times |
Fri 30 May 2025 |
51.62 (-2.66%) |
52.69 |
49.83 - 52.69 |
1.3388 times |
Wed 30 April 2025 |
53.03 (-3.3%) |
54.60 |
49.04 - 55.66 |
2.1709 times |
Mon 31 March 2025 |
54.84 (-1.31%) |
55.04 |
53.56 - 55.85 |
1.3225 times |
Fri 28 February 2025 |
55.57 (4.59%) |
54.00 |
52.78 - 55.71 |
0.6591 times |
Fri 31 January 2025 |
53.13 (2.04%) |
52.24 |
50.80 - 53.49 |
1.091 times |
Tue 31 December 2024 |
52.07 (-4.65%) |
55.25 |
51.88 - 55.25 |
1.0142 times |

DMA SMA EMA moving averages of 15 Year LTPZ
DMA (daily moving average) of 15 Year LTPZ
| DMA period | DMA value | | 5 day DMA | 54.53 | | 12 day DMA | 54.05 | | 20 day DMA | 53.7 | | 35 day DMA | 53.5 | | 50 day DMA | 52.97 | | 100 day DMA | 52.31 | | 150 day DMA | 52.31 | | 200 day DMA | 52.56 | EMA (exponential moving average) of 15 Year LTPZ
| EMA period | EMA current | EMA prev | EMA prev2 | | 5 day EMA | 54.46 | 54.44 | 54.42 | | 12 day EMA | 54.14 | 54.08 | 54.01 | | 20 day EMA | 53.87 | 53.81 | 53.74 | | 35 day EMA | 53.43 | 53.37 | 53.3 | | 50 day EMA | 53.05 | 52.99 | 52.93 |
SMA (simple moving average) of 15 Year LTPZ
| SMA period | SMA current | SMA prev | SMA prev2 | | 5 day SMA | 54.53 | 54.43 | 54.38 | | 12 day SMA | 54.05 | 53.94 | 53.84 | | 20 day SMA | 53.7 | 53.64 | 53.56 | | 35 day SMA | 53.5 | 53.41 | 53.33 | | 50 day SMA | 52.97 | 52.92 | 52.87 | | 100 day SMA | 52.31 | 52.28 | 52.24 | | 150 day SMA | 52.31 | 52.3 | 52.3 | | 200 day SMA | 52.56 | 52.55 | 52.54 |
|
|
