UltraTelecommunications LTL full analysis,charts,indicators,moving averages,SMA,DMA,EMA,ADX,MACD,RSIUltra Telecommunications LTL WideScreen charts, DMA,SMA,EMA technical analysis, forecast prediction, by indicators ADX,MACD,RSI,CCI AMEX stock exchange
Daily price and charts and targets UltraTelecommunications Strong Daily Stock price targets for UltraTelecommunications LTL are 109.69 and 111.11 | Daily Target 1 | 109.45 | | Daily Target 2 | 109.93 | | Daily Target 3 | 110.87333333333 | | Daily Target 4 | 111.35 | | Daily Target 5 | 112.29 |
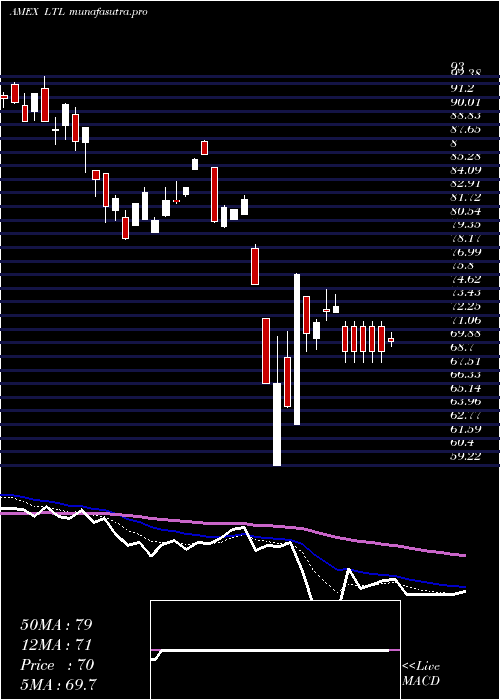
Daily price and volume Ultra Telecommunications
| Date |
Closing |
Open |
Range |
Volume |
Fri 24 October 2025 |
110.40 (-0.13%) |
111.82 |
110.40 - 111.82 |
0.6564 times |
Thu 23 October 2025 |
110.54 (-0.08%) |
110.63 |
110.30 - 110.77 |
0.4527 times |
Wed 22 October 2025 |
110.63 (-1.98%) |
112.11 |
110.04 - 112.13 |
1.509 times |
Tue 21 October 2025 |
112.87 (0.66%) |
112.76 |
111.64 - 113.05 |
2.8935 times |
Mon 20 October 2025 |
112.13 (2.44%) |
110.59 |
110.59 - 112.13 |
0.4329 times |
Fri 17 October 2025 |
109.46 (1.28%) |
108.98 |
108.47 - 109.46 |
0.1823 times |
Thu 16 October 2025 |
108.08 (-1.85%) |
110.82 |
107.86 - 110.82 |
0.3418 times |
Wed 15 October 2025 |
110.12 (1.19%) |
111.37 |
109.82 - 111.37 |
2.0733 times |
Tue 14 October 2025 |
108.82 (1.17%) |
106.34 |
106.30 - 108.82 |
0.2962 times |
Mon 13 October 2025 |
107.56 (-3.86%) |
107.78 |
107.36 - 108.00 |
1.162 times |
Tue 07 October 2025 |
111.88 (-0.84%) |
113.17 |
111.88 - 113.17 |
0.3645 times |
Weekly price and charts UltraTelecommunications Strong weekly Stock price targets for UltraTelecommunications LTL are 108.72 and 111.73 | Weekly Target 1 | 108.15 | | Weekly Target 2 | 109.28 | | Weekly Target 3 | 111.16333333333 | | Weekly Target 4 | 112.29 | | Weekly Target 5 | 114.17 |
Weekly price and volumes for Ultra Telecommunications
| Date |
Closing |
Open |
Range |
Volume |
Fri 24 October 2025 |
110.40 (0.86%) |
110.59 |
110.04 - 113.05 |
1.5032 times |
Fri 17 October 2025 |
109.46 (-2.16%) |
107.78 |
106.30 - 111.37 |
1.0255 times |
Tue 07 October 2025 |
111.88 (-0.61%) |
111.40 |
111.40 - 113.17 |
0.1321 times |
Fri 03 October 2025 |
112.57 (-3.16%) |
117.15 |
112.28 - 117.99 |
1.5089 times |
Fri 26 September 2025 |
116.24 (-1.76%) |
118.51 |
113.52 - 118.68 |
1.3769 times |
Fri 19 September 2025 |
118.32 (3.56%) |
115.55 |
115.25 - 118.32 |
0.8411 times |
Fri 12 September 2025 |
114.25 (4.72%) |
109.02 |
108.55 - 114.51 |
1.5959 times |
Fri 05 September 2025 |
109.10 (5.93%) |
97.29 |
97.29 - 109.83 |
1.1177 times |
Fri 29 August 2025 |
102.99 (0%) |
102.79 |
102.67 - 102.99 |
0.0922 times |
Fri 29 August 2025 |
102.99 (-0.01%) |
102.11 |
101.96 - 104.08 |
0.8066 times |
Fri 22 August 2025 |
103.00 (-0.59%) |
102.94 |
99.24 - 103.78 |
0.749 times |

Monthly price and charts UltraTelecommunications Strong monthly Stock price targets for UltraTelecommunications LTL are 104.36 and 112.34 | Monthly Target 1 | 102.35 | | Monthly Target 2 | 106.37 | | Monthly Target 3 | 110.32666666667 | | Monthly Target 4 | 114.35 | | Monthly Target 5 | 118.31 |
Monthly price and volumes Ultra Telecommunications
| Date |
Closing |
Open |
Range |
Volume |
Fri 24 October 2025 |
110.40 (-5.46%) |
113.79 |
106.30 - 114.28 |
0.5372 times |
Tue 30 September 2025 |
116.77 (13.38%) |
97.29 |
97.29 - 118.68 |
0.9954 times |
Fri 29 August 2025 |
102.99 (6.37%) |
95.24 |
94.00 - 104.24 |
0.6132 times |
Thu 31 July 2025 |
96.82 (-2.76%) |
98.73 |
93.21 - 100.45 |
1.785 times |
Mon 30 June 2025 |
99.57 (14.11%) |
86.33 |
85.74 - 99.62 |
0.5829 times |
Fri 30 May 2025 |
87.26 (11.81%) |
78.78 |
78.51 - 88.85 |
0.9293 times |
Wed 30 April 2025 |
78.04 (-4.46%) |
80.58 |
59.22 - 82.68 |
1.5242 times |
Mon 31 March 2025 |
81.68 (-10.81%) |
91.95 |
78.83 - 93.00 |
1.0702 times |
Fri 28 February 2025 |
91.58 (-1.38%) |
88.19 |
88.19 - 98.43 |
1.0148 times |
Fri 31 January 2025 |
92.86 (11.25%) |
84.10 |
80.35 - 94.51 |
0.9478 times |
Tue 31 December 2024 |
83.47 (-2.68%) |
88.37 |
83.47 - 94.03 |
0.4473 times |

DMA SMA EMA moving averages of Ultra Telecommunications LTL
DMA (daily moving average) of Ultra Telecommunications LTL
| DMA period | DMA value | | 5 day DMA | 111.31 | | 12 day DMA | 110.44 | | 20 day DMA | 112.14 | | 35 day DMA | 112.65 | | 50 day DMA | 109.63 | | 100 day DMA | 101.98 | | 150 day DMA | 94.15 | | 200 day DMA | 92.86 | EMA (exponential moving average) of Ultra Telecommunications LTL
| EMA period | EMA current | EMA prev | EMA prev2 | | 5 day EMA | 110.71 | 110.86 | 111.02 | | 12 day EMA | 111.08 | 111.2 | 111.32 | | 20 day EMA | 111.34 | 111.44 | 111.54 | | 35 day EMA | 109.96 | 109.93 | 109.89 | | 50 day EMA | 108.81 | 108.75 | 108.68 |
SMA (simple moving average) of Ultra Telecommunications LTL
| SMA period | SMA current | SMA prev | SMA prev2 | | 5 day SMA | 111.31 | 111.13 | 110.63 | | 12 day SMA | 110.44 | 110.62 | 110.8 | | 20 day SMA | 112.14 | 112.47 | 112.81 | | 35 day SMA | 112.65 | 112.43 | 112.22 | | 50 day SMA | 109.63 | 109.45 | 109.19 | | 100 day SMA | 101.98 | 101.76 | 101.53 | | 150 day SMA | 94.15 | 93.95 | 93.77 | | 200 day SMA | 92.86 | 92.74 | 92.62 |
|
|
