IboxxInvest LQD full analysis,charts,indicators,moving averages,SMA,DMA,EMA,ADX,MACD,RSIIboxx Invest LQD WideScreen charts, DMA,SMA,EMA technical analysis, forecast prediction, by indicators ADX,MACD,RSI,CCI AMEX stock exchange
Daily price and charts and targets IboxxInvest Strong Daily Stock price targets for IboxxInvest LQD are 112.05 and 112.26 | Daily Target 1 | 112 | | Daily Target 2 | 112.1 | | Daily Target 3 | 112.21 | | Daily Target 4 | 112.31 | | Daily Target 5 | 112.42 |
Daily price and volume Iboxx Invest
| Date |
Closing |
Open |
Range |
Volume |
Fri 17 October 2025 |
112.20 (-0.2%) |
112.29 |
112.11 - 112.32 |
1.2152 times |
Thu 16 October 2025 |
112.42 (0.29%) |
112.05 |
111.98 - 112.44 |
1.367 times |
Wed 15 October 2025 |
112.10 (0%) |
112.26 |
111.91 - 112.50 |
1.5439 times |
Tue 14 October 2025 |
112.10 (0.33%) |
111.52 |
111.48 - 112.13 |
1.5081 times |
Mon 13 October 2025 |
111.73 (0.3%) |
111.40 |
111.33 - 111.80 |
0.3853 times |
Tue 07 October 2025 |
111.40 (0.19%) |
111.34 |
111.17 - 111.49 |
1.0103 times |
Mon 06 October 2025 |
111.19 (-0.32%) |
111.39 |
111.16 - 111.47 |
0.652 times |
Fri 03 October 2025 |
111.55 (-0.13%) |
111.84 |
111.48 - 111.84 |
0.6802 times |
Thu 02 October 2025 |
111.69 (0.16%) |
111.49 |
111.41 - 111.73 |
0.6002 times |
Wed 01 October 2025 |
111.51 (0.04%) |
111.44 |
111.23 - 111.51 |
1.0379 times |
Tue 30 September 2025 |
111.47 (-0.1%) |
111.65 |
111.38 - 111.86 |
1.1983 times |
Weekly price and charts IboxxInvest Strong weekly Stock price targets for IboxxInvest LQD are 111.77 and 112.94 | Weekly Target 1 | 110.84 | | Weekly Target 2 | 111.52 | | Weekly Target 3 | 112.01 | | Weekly Target 4 | 112.69 | | Weekly Target 5 | 113.18 |
Weekly price and volumes for Iboxx Invest
| Date |
Closing |
Open |
Range |
Volume |
Fri 17 October 2025 |
112.20 (0.72%) |
111.40 |
111.33 - 112.50 |
1.4131 times |
Tue 07 October 2025 |
111.40 (-0.13%) |
111.39 |
111.16 - 111.49 |
0.3902 times |
Fri 03 October 2025 |
111.55 (0.31%) |
111.46 |
111.23 - 111.86 |
1.0828 times |
Fri 26 September 2025 |
111.21 (-0.47%) |
111.64 |
110.68 - 111.75 |
1.2977 times |
Fri 19 September 2025 |
111.74 (-0.24%) |
112.23 |
111.52 - 112.64 |
1.2001 times |
Fri 12 September 2025 |
112.01 (0.76%) |
111.51 |
111.12 - 112.33 |
1.1169 times |
Fri 05 September 2025 |
111.17 (1.25%) |
108.88 |
108.81 - 111.31 |
1.1661 times |
Fri 29 August 2025 |
109.80 (0%) |
109.99 |
109.75 - 110.01 |
0.2592 times |
Fri 29 August 2025 |
109.80 (-0.36%) |
109.97 |
109.59 - 110.31 |
1.0184 times |
Fri 22 August 2025 |
110.20 (0.42%) |
109.82 |
109.19 - 110.31 |
1.0555 times |
Fri 15 August 2025 |
109.74 (0.3%) |
109.57 |
109.27 - 110.32 |
0.9533 times |

Monthly price and charts IboxxInvest Strong monthly Stock price targets for IboxxInvest LQD are 111.68 and 113.02 | Monthly Target 1 | 110.61 | | Monthly Target 2 | 111.41 | | Monthly Target 3 | 111.95333333333 | | Monthly Target 4 | 112.75 | | Monthly Target 5 | 113.29 |
Monthly price and volumes Iboxx Invest
| Date |
Closing |
Open |
Range |
Volume |
Fri 17 October 2025 |
112.20 (0.65%) |
111.44 |
111.16 - 112.50 |
0.5389 times |
Tue 30 September 2025 |
111.47 (1.52%) |
108.88 |
108.81 - 112.64 |
1.2213 times |
Fri 29 August 2025 |
109.80 (0.63%) |
109.32 |
109.12 - 110.32 |
1.0313 times |
Thu 31 July 2025 |
109.11 (-0.46%) |
109.26 |
107.34 - 109.50 |
1.003 times |
Mon 30 June 2025 |
109.61 (1.71%) |
106.99 |
106.69 - 109.72 |
0.9887 times |
Fri 30 May 2025 |
107.77 (-0.19%) |
107.76 |
105.39 - 107.77 |
1.0448 times |
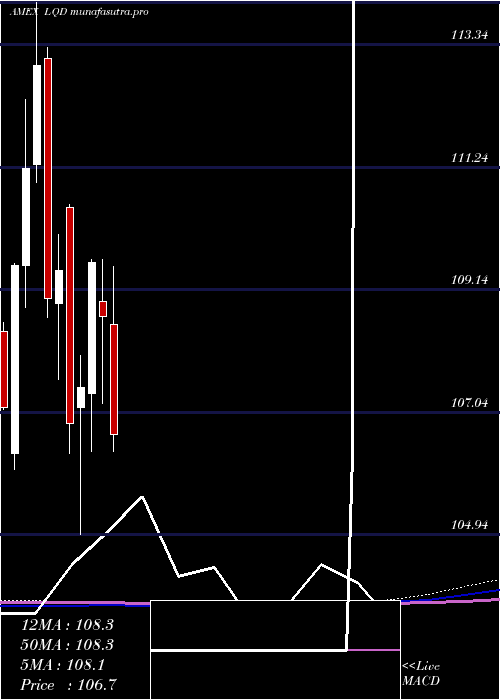
Wed 30 April 2025 |
107.98 (-0.65%) |
108.53 |
103.45 - 109.54 |
1.2621 times |
Mon 31 March 2025 |
108.69 (-0.84%) |
108.94 |
107.18 - 109.65 |
1.143 times |
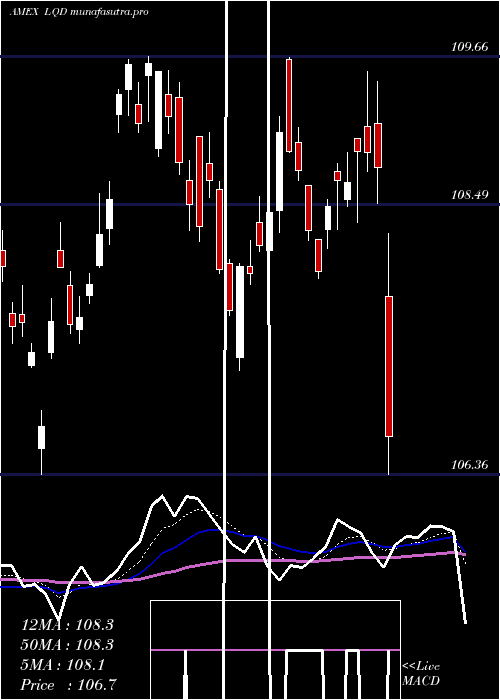
Fri 28 February 2025 |
109.61 (2%) |
107.36 |
106.36 - 109.66 |
0.8353 times |
Fri 31 January 2025 |
107.46 (0.58%) |
107.12 |
104.94 - 108.02 |
0.9314 times |
Tue 31 December 2024 |
106.84 (-2.4%) |
110.54 |
106.33 - 110.60 |
0.5891 times |
DMA SMA EMA moving averages of Iboxx Invest LQD
DMA (daily moving average) of Iboxx Invest LQD
| DMA period | DMA value | | 5 day DMA | 112.11 | | 12 day DMA | 111.75 | | 20 day DMA | 111.67 | | 35 day DMA | 111.34 | | 50 day DMA | 110.87 | | 100 day DMA | 109.54 | | 150 day DMA | 108.81 | | 200 day DMA | 108.48 | EMA (exponential moving average) of Iboxx Invest LQD
| EMA period | EMA current | EMA prev | EMA prev2 | | 5 day EMA | 112.09 | 112.03 | 111.84 | | 12 day EMA | 111.84 | 111.78 | 111.66 | | 20 day EMA | 111.67 | 111.61 | 111.52 | | 35 day EMA | 111.25 | 111.19 | 111.12 | | 50 day EMA | 110.87 | 110.82 | 110.75 |
SMA (simple moving average) of Iboxx Invest LQD
| SMA period | SMA current | SMA prev | SMA prev2 | | 5 day SMA | 112.11 | 111.95 | 111.7 | | 12 day SMA | 111.75 | 111.66 | 111.55 | | 20 day SMA | 111.67 | 111.67 | 111.67 | | 35 day SMA | 111.34 | 111.28 | 111.21 | | 50 day SMA | 110.87 | 110.83 | 110.77 | | 100 day SMA | 109.54 | 109.49 | 109.44 | | 150 day SMA | 108.81 | 108.79 | 108.76 | | 200 day SMA | 108.48 | 108.45 | 108.42 |
|
|
