GX LIT full analysis,charts,indicators,moving averages,SMA,DMA,EMA,ADX,MACD,RSIG X LIT WideScreen charts, DMA,SMA,EMA technical analysis, forecast prediction, by indicators ADX,MACD,RSI,CCI AMEX stock exchange
Daily price and charts and targets GX Strong Daily Stock price targets for GX LIT are 57.33 and 59.29 | Daily Target 1 | 55.71 | | Daily Target 2 | 56.98 | | Daily Target 3 | 57.666666666667 | | Daily Target 4 | 58.94 | | Daily Target 5 | 59.63 |
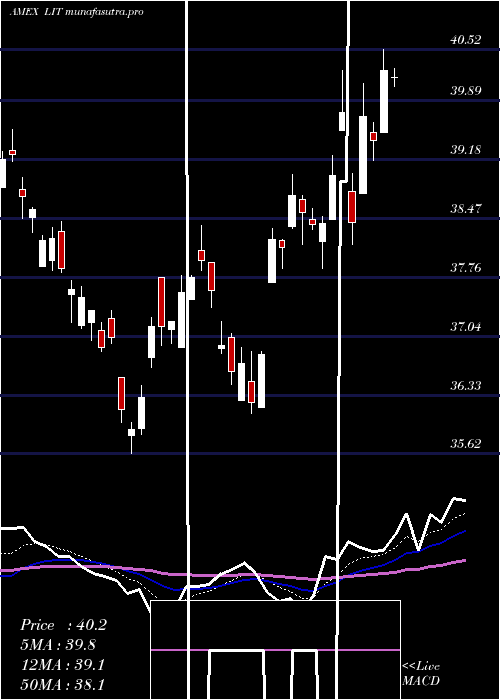
Daily price and volume G X
| Date |
Closing |
Open |
Range |
Volume |
Thu 23 October 2025 |
58.26 (3.33%) |
57.07 |
56.39 - 58.35 |
0.2411 times |
Wed 22 October 2025 |
56.38 (-1.52%) |
56.70 |
55.80 - 57.20 |
0.8756 times |
Tue 21 October 2025 |
57.25 (-0.69%) |
57.83 |
56.78 - 57.83 |
1.0176 times |
Mon 20 October 2025 |
57.65 (1.43%) |
57.79 |
57.15 - 57.79 |
0.3501 times |
Fri 17 October 2025 |
56.84 (-1.01%) |
55.74 |
55.30 - 57.13 |
0.4837 times |
Thu 16 October 2025 |
57.42 (0.14%) |
58.02 |
57.01 - 58.85 |
0.7844 times |
Wed 15 October 2025 |
57.34 (0.12%) |
57.94 |
56.76 - 58.00 |
1.3569 times |
Tue 14 October 2025 |
57.27 (-1.63%) |
56.00 |
55.46 - 57.78 |
0.7286 times |
Mon 13 October 2025 |
58.22 (7.97%) |
57.18 |
57.00 - 58.44 |
1.7941 times |
Fri 10 October 2025 |
53.92 (-8.8%) |
56.80 |
53.88 - 57.00 |
2.368 times |
Thu 09 October 2025 |
59.12 (-0.95%) |
60.00 |
58.87 - 60.00 |
0.77 times |
Weekly price and charts GX Strong weekly Stock price targets for GX LIT are 57.03 and 59.58 | Weekly Target 1 | 54.92 | | Weekly Target 2 | 56.59 | | Weekly Target 3 | 57.47 | | Weekly Target 4 | 59.14 | | Weekly Target 5 | 60.02 |
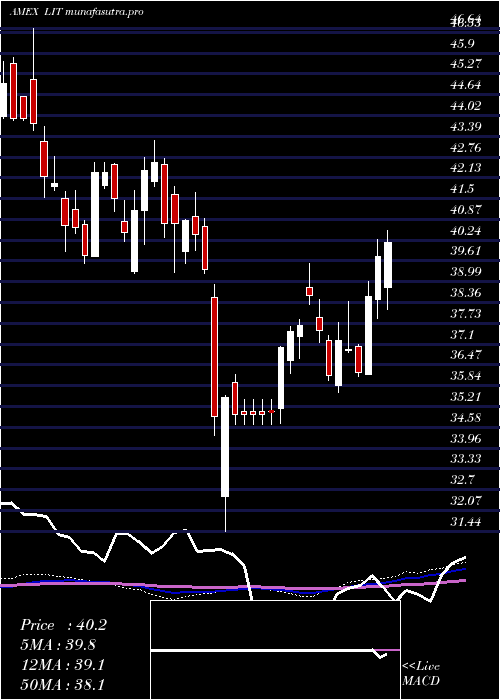
Weekly price and volumes for G X
| Date |
Closing |
Open |
Range |
Volume |
Thu 23 October 2025 |
58.26 (2.5%) |
57.79 |
55.80 - 58.35 |
0.8895 times |
Fri 17 October 2025 |
56.84 (5.42%) |
57.18 |
55.30 - 58.85 |
1.8431 times |
Fri 10 October 2025 |
53.92 (-8.42%) |
59.67 |
53.88 - 60.10 |
1.9042 times |
Fri 03 October 2025 |
58.88 (5.99%) |
56.59 |
56.33 - 59.30 |
1.0093 times |
Fri 26 September 2025 |
55.55 (5.11%) |
52.71 |
52.50 - 56.25 |
1.057 times |
Fri 19 September 2025 |
52.85 (5.68%) |
51.30 |
51.30 - 53.31 |
0.7709 times |
Fri 12 September 2025 |
50.01 (-1.09%) |
51.38 |
48.70 - 51.68 |
0.7667 times |
Fri 05 September 2025 |
50.56 (6.53%) |
46.59 |
46.27 - 50.90 |
0.8034 times |
Fri 29 August 2025 |
47.46 (0%) |
47.50 |
47.26 - 47.97 |
0.2019 times |
Fri 29 August 2025 |
47.46 (2.04%) |
46.09 |
46.00 - 47.97 |
0.7539 times |
Fri 22 August 2025 |
46.51 (1.11%) |
46.18 |
44.66 - 46.51 |
0.8386 times |
Monthly price and charts GX Strong monthly Stock price targets for GX LIT are 56.07 and 62.29 | Monthly Target 1 | 51.19 | | Monthly Target 2 | 54.73 | | Monthly Target 3 | 57.413333333333 | | Monthly Target 4 | 60.95 | | Monthly Target 5 | 63.63 |
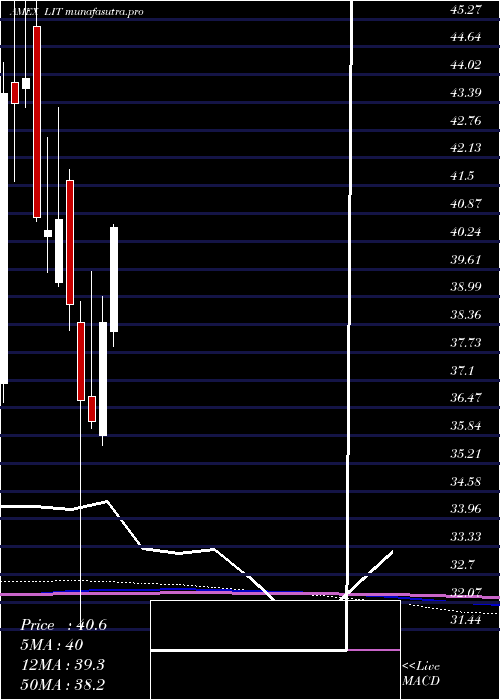
Monthly price and volumes G X
| Date |
Closing |
Open |
Range |
Volume |
Thu 23 October 2025 |
58.26 (2.48%) |
56.85 |
53.88 - 60.10 |
1.6337 times |
Tue 30 September 2025 |
56.85 (19.79%) |
46.59 |
46.27 - 57.32 |
1.225 times |
Fri 29 August 2025 |
47.46 (15.81%) |
40.76 |
40.41 - 47.97 |
1.1156 times |
Thu 31 July 2025 |
40.98 (6.72%) |
38.19 |
37.86 - 44.94 |
1.5112 times |
Mon 30 June 2025 |
38.40 (6.19%) |
35.84 |
35.62 - 39.00 |
0.6182 times |
Fri 30 May 2025 |
36.16 (-1.31%) |
36.73 |
36.00 - 39.55 |
0.526 times |
Wed 30 April 2025 |
36.64 (-5.57%) |
38.40 |
31.44 - 38.87 |
0.7551 times |
Mon 31 March 2025 |
38.80 (-4.76%) |
41.61 |
38.22 - 41.86 |
0.7374 times |
Fri 28 February 2025 |
40.74 (0.62%) |
39.30 |
39.22 - 43.27 |
0.836 times |
Fri 31 January 2025 |
40.49 (-0.71%) |
40.34 |
39.54 - 42.59 |
1.0418 times |
Tue 31 December 2024 |
40.78 (-7.17%) |
45.10 |
40.69 - 46.64 |
0.8858 times |
DMA SMA EMA moving averages of G X LIT
DMA (daily moving average) of G X LIT
| DMA period | DMA value | | 5 day DMA | 57.28 | | 12 day DMA | 57.45 | | 20 day DMA | 57.57 | | 35 day DMA | 55.18 | | 50 day DMA | 52.55 | | 100 day DMA | 46.41 | | 150 day DMA | 43.24 | | 200 day DMA | 42.73 | EMA (exponential moving average) of G X LIT
| EMA period | EMA current | EMA prev | EMA prev2 | | 5 day EMA | 57.43 | 57.01 | 57.33 | | 12 day EMA | 57.29 | 57.11 | 57.24 | | 20 day EMA | 56.68 | 56.51 | 56.52 | | 35 day EMA | 54.73 | 54.52 | 54.41 | | 50 day EMA | 52.46 | 52.22 | 52.05 |
SMA (simple moving average) of G X LIT
| SMA period | SMA current | SMA prev | SMA prev2 | | 5 day SMA | 57.28 | 57.11 | 57.3 | | 12 day SMA | 57.45 | 57.49 | 57.76 | | 20 day SMA | 57.57 | 57.46 | 57.4 | | 35 day SMA | 55.18 | 54.86 | 54.59 | | 50 day SMA | 52.55 | 52.29 | 52.09 | | 100 day SMA | 46.41 | 46.19 | 46 | | 150 day SMA | 43.24 | 43.13 | 43.03 | | 200 day SMA | 42.73 | 42.64 | 42.56 |
|
|
