LglGroup LGL full analysis,charts,indicators,moving averages,SMA,DMA,EMA,ADX,MACD,RSILgl Group LGL WideScreen charts, DMA,SMA,EMA technical analysis, forecast prediction, by indicators ADX,MACD,RSI,CCI AMEX stock exchange
Daily price and charts and targets LglGroup Strong Daily Stock price targets for LglGroup LGL are 6.37 and 6.37 | Daily Target 1 | 6.37 | | Daily Target 2 | 6.37 | | Daily Target 3 | 6.37 | | Daily Target 4 | 6.37 | | Daily Target 5 | 6.37 |
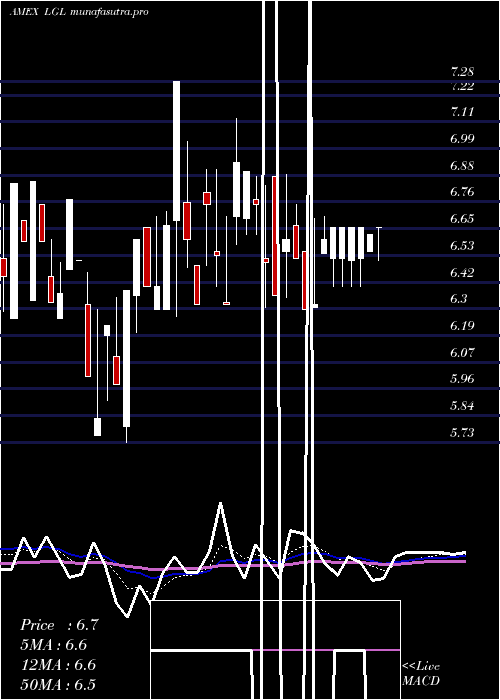
Daily price and volume Lgl Group
| Date |
Closing |
Open |
Range |
Volume |
Thu 23 October 2025 |
6.37 (1.43%) |
6.37 |
6.37 - 6.37 |
0.0571 times |
Wed 22 October 2025 |
6.28 (0.48%) |
6.35 |
6.28 - 6.39 |
0.3503 times |
Tue 21 October 2025 |
6.25 (-0.16%) |
6.27 |
6.25 - 6.27 |
0.3994 times |
Mon 20 October 2025 |
6.26 (0.97%) |
6.15 |
6.15 - 6.26 |
0.1141 times |
Fri 17 October 2025 |
6.20 (-2.36%) |
6.28 |
6.20 - 6.39 |
1.7566 times |
Thu 16 October 2025 |
6.35 (0.16%) |
6.45 |
6.25 - 6.45 |
0.6475 times |
Wed 15 October 2025 |
6.34 (2.26%) |
6.34 |
6.27 - 6.34 |
1.9398 times |
Tue 14 October 2025 |
6.20 (-1.74%) |
6.29 |
6.20 - 6.45 |
2.5673 times |
Mon 13 October 2025 |
6.31 (-2.77%) |
6.25 |
6.25 - 6.52 |
1.141 times |
Fri 10 October 2025 |
6.49 (2.04%) |
6.36 |
6.35 - 6.49 |
1.0269 times |
Thu 09 October 2025 |
6.36 (-2.6%) |
6.50 |
6.29 - 6.50 |
1.1981 times |
Weekly price and charts LglGroup Strong weekly Stock price targets for LglGroup LGL are 6.26 and 6.5 | Weekly Target 1 | 6.06 | | Weekly Target 2 | 6.22 | | Weekly Target 3 | 6.3033333333333 | | Weekly Target 4 | 6.46 | | Weekly Target 5 | 6.54 |
Weekly price and volumes for Lgl Group
| Date |
Closing |
Open |
Range |
Volume |
Thu 23 October 2025 |
6.37 (2.74%) |
6.15 |
6.15 - 6.39 |
0.0587 times |
Fri 17 October 2025 |
6.20 (-4.47%) |
6.25 |
6.20 - 6.52 |
0.5131 times |
Fri 10 October 2025 |
6.49 (-2.41%) |
6.52 |
6.25 - 6.60 |
1.2857 times |
Fri 03 October 2025 |
6.65 (-0.75%) |
6.70 |
6.55 - 6.92 |
0.6177 times |
Fri 26 September 2025 |
6.70 (-5.1%) |
6.81 |
6.57 - 7.00 |
1.0324 times |
Fri 19 September 2025 |
7.06 (8.12%) |
6.29 |
6.02 - 7.26 |
4.2532 times |
Fri 12 September 2025 |
6.53 (-1.21%) |
6.78 |
6.50 - 6.82 |
0.927 times |
Fri 05 September 2025 |
6.61 (1.85%) |
6.50 |
6.50 - 6.72 |
0.1963 times |
Fri 29 August 2025 |
6.49 (0%) |
6.49 |
6.40 - 6.50 |
0.2872 times |
Fri 29 August 2025 |
6.49 (-1.67%) |
6.60 |
6.33 - 6.81 |
0.8288 times |
Fri 22 August 2025 |
6.60 (-5.04%) |
6.90 |
6.27 - 6.99 |
0.7779 times |

Monthly price and charts LglGroup Strong monthly Stock price targets for LglGroup LGL are 5.94 and 6.59 | Monthly Target 1 | 5.79 | | Monthly Target 2 | 6.08 | | Monthly Target 3 | 6.44 | | Monthly Target 4 | 6.73 | | Monthly Target 5 | 7.09 |
Monthly price and volumes Lgl Group
| Date |
Closing |
Open |
Range |
Volume |
Thu 23 October 2025 |
6.37 (-4.5%) |
6.79 |
6.15 - 6.80 |
0.3241 times |
Tue 30 September 2025 |
6.67 (2.77%) |
6.50 |
6.02 - 7.26 |
0.9833 times |
Fri 29 August 2025 |
6.49 (-10.85%) |
7.06 |
6.27 - 7.23 |
0.4478 times |
Thu 31 July 2025 |
7.28 (-4.46%) |
7.45 |
6.89 - 7.79 |
1.0937 times |
Mon 30 June 2025 |
7.62 (16.51%) |
6.60 |
5.88 - 9.74 |
4.353 times |
Fri 30 May 2025 |
6.54 (-4.53%) |
6.86 |
6.12 - 7.08 |
0.3868 times |
Wed 30 April 2025 |
6.85 (4.9%) |
6.33 |
6.30 - 7.12 |
0.5648 times |
Mon 31 March 2025 |
6.53 (-4.67%) |
6.75 |
5.73 - 7.28 |
0.4943 times |
Fri 28 February 2025 |
6.85 (3.79%) |
6.59 |
6.26 - 7.01 |
0.4007 times |
Fri 31 January 2025 |
6.60 (10.55%) |
6.05 |
6.00 - 6.99 |
0.9514 times |
Tue 31 December 2024 |
5.97 (-0.5%) |
6.00 |
5.75 - 6.45 |
0.3829 times |

DMA SMA EMA moving averages of Lgl Group LGL
DMA (daily moving average) of Lgl Group LGL
| DMA period | DMA value | | 5 day DMA | 6.27 | | 12 day DMA | 6.33 | | 20 day DMA | 6.45 | | 35 day DMA | 6.53 | | 50 day DMA | 6.56 | | 100 day DMA | 6.84 | | 150 day DMA | 6.78 | | 200 day DMA | 6.72 | EMA (exponential moving average) of Lgl Group LGL
| EMA period | EMA current | EMA prev | EMA prev2 | | 5 day EMA | 6.31 | 6.28 | 6.28 | | 12 day EMA | 6.34 | 6.34 | 6.35 | | 20 day EMA | 6.41 | 6.41 | 6.42 | | 35 day EMA | 6.49 | 6.5 | 6.51 | | 50 day EMA | 6.58 | 6.59 | 6.6 |
SMA (simple moving average) of Lgl Group LGL
| SMA period | SMA current | SMA prev | SMA prev2 | | 5 day SMA | 6.27 | 6.27 | 6.28 | | 12 day SMA | 6.33 | 6.34 | 6.36 | | 20 day SMA | 6.45 | 6.48 | 6.5 | | 35 day SMA | 6.53 | 6.54 | 6.55 | | 50 day SMA | 6.56 | 6.57 | 6.59 | | 100 day SMA | 6.84 | 6.84 | 6.85 | | 150 day SMA | 6.78 | 6.77 | 6.77 | | 200 day SMA | 6.72 | 6.72 | 6.72 |
|
|
