KsEm KEMQ full analysis,charts,indicators,moving averages,SMA,DMA,EMA,ADX,MACD,RSIKs Em KEMQ WideScreen charts, DMA,SMA,EMA technical analysis, forecast prediction, by indicators ADX,MACD,RSI,CCI AMEX stock exchange
Daily price and charts and targets KsEm Strong Daily Stock price targets for KsEm KEMQ are 26.09 and 26.29 | Daily Target 1 | 25.92 | | Daily Target 2 | 26.06 | | Daily Target 3 | 26.123333333333 | | Daily Target 4 | 26.26 | | Daily Target 5 | 26.32 |
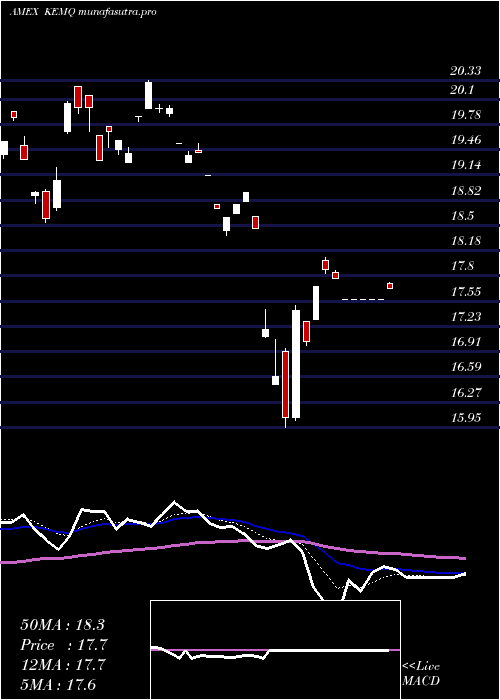
Daily price and volume Ks Em
| Date |
Closing |
Open |
Range |
Volume |
Thu 23 October 2025 |
26.19 (1.16%) |
26.08 |
25.99 - 26.19 |
0.142 times |
Wed 22 October 2025 |
25.89 (-0.96%) |
25.97 |
25.63 - 26.12 |
0.2437 times |
Tue 21 October 2025 |
26.14 (-1.32%) |
26.31 |
26.08 - 26.31 |
0.5625 times |
Mon 20 October 2025 |
26.49 (1.92%) |
26.12 |
26.12 - 26.49 |
0.0875 times |
Fri 17 October 2025 |
25.99 (0.04%) |
25.79 |
25.79 - 26.05 |
0.0467 times |
Thu 16 October 2025 |
25.98 (0.78%) |
26.14 |
25.92 - 26.19 |
0.0679 times |
Wed 15 October 2025 |
25.78 (0.39%) |
25.96 |
25.77 - 26.06 |
0.3524 times |
Tue 14 October 2025 |
25.68 (-1.87%) |
25.34 |
25.34 - 25.90 |
0.6474 times |
Mon 13 October 2025 |
26.17 (-3%) |
26.16 |
26.13 - 26.28 |
0.0828 times |
Tue 07 October 2025 |
26.98 (-0.95%) |
27.39 |
26.98 - 27.39 |
7.7671 times |
Mon 06 October 2025 |
27.24 (0.63%) |
27.18 |
27.18 - 27.29 |
0.1308 times |
Weekly price and charts KsEm Strong weekly Stock price targets for KsEm KEMQ are 25.91 and 26.77 | Weekly Target 1 | 25.24 | | Weekly Target 2 | 25.72 | | Weekly Target 3 | 26.103333333333 | | Weekly Target 4 | 26.58 | | Weekly Target 5 | 26.96 |
Weekly price and volumes for Ks Em
| Date |
Closing |
Open |
Range |
Volume |
Thu 23 October 2025 |
26.19 (0.77%) |
26.12 |
25.63 - 26.49 |
0.5213 times |
Fri 17 October 2025 |
25.99 (-3.67%) |
26.16 |
25.34 - 26.28 |
0.6026 times |
Tue 07 October 2025 |
26.98 (-0.33%) |
27.18 |
26.98 - 27.39 |
3.9756 times |
Fri 03 October 2025 |
27.07 (4.44%) |
26.36 |
26.30 - 27.19 |
0.5014 times |
Fri 26 September 2025 |
25.92 (-2.41%) |
26.48 |
25.79 - 26.53 |
0.6924 times |
Fri 19 September 2025 |
26.56 (4.24%) |
25.73 |
25.66 - 26.77 |
1.0504 times |
Fri 12 September 2025 |
25.48 (6.17%) |
24.12 |
24.12 - 25.48 |
1.6028 times |
Fri 05 September 2025 |
24.00 (1.35%) |
23.20 |
23.14 - 24.09 |
0.3377 times |
Fri 29 August 2025 |
23.68 (0%) |
23.65 |
23.61 - 23.71 |
0.063 times |
Fri 29 August 2025 |
23.68 (-0.08%) |
23.89 |
23.29 - 23.95 |
0.6529 times |
Fri 22 August 2025 |
23.70 (1.67%) |
23.55 |
23.03 - 23.74 |
0.1592 times |

Monthly price and charts KsEm Strong monthly Stock price targets for KsEm KEMQ are 24.74 and 26.79 | Monthly Target 1 | 24.26 | | Monthly Target 2 | 25.22 | | Monthly Target 3 | 26.306666666667 | | Monthly Target 4 | 27.27 | | Monthly Target 5 | 28.36 |
Monthly price and volumes Ks Em
| Date |
Closing |
Open |
Range |
Volume |
Thu 23 October 2025 |
26.19 (-0.68%) |
26.58 |
25.34 - 27.39 |
2.6602 times |
Tue 30 September 2025 |
26.37 (11.36%) |
23.20 |
23.14 - 26.77 |
1.8712 times |
Fri 29 August 2025 |
23.68 (5.43%) |
22.23 |
21.96 - 23.95 |
0.5919 times |
Thu 31 July 2025 |
22.46 (-0.27%) |
22.50 |
22.00 - 23.38 |
1.6283 times |
Mon 30 June 2025 |
22.52 (13.17%) |
20.08 |
20.07 - 22.56 |
0.315 times |
Fri 30 May 2025 |
19.90 (7.57%) |
18.70 |
18.59 - 20.58 |
0.1643 times |
Wed 30 April 2025 |
18.50 (-0.54%) |
18.65 |
15.95 - 18.92 |
0.4365 times |
Mon 31 March 2025 |
18.60 (-1.69%) |
18.93 |
18.38 - 20.33 |
0.6184 times |
Fri 28 February 2025 |
18.92 (7.56%) |
17.43 |
17.43 - 20.68 |
0.6691 times |
Fri 31 January 2025 |
17.59 (5.9%) |
16.60 |
15.99 - 18.00 |
1.045 times |
Tue 31 December 2024 |
16.61 (-3.15%) |
18.42 |
16.61 - 18.62 |
0.0948 times |

DMA SMA EMA moving averages of Ks Em KEMQ
DMA (daily moving average) of Ks Em KEMQ
| DMA period | DMA value | | 5 day DMA | 26.14 | | 12 day DMA | 26.3 | | 20 day DMA | 26.34 | | 35 day DMA | 25.83 | | 50 day DMA | 25.11 | | 100 day DMA | 23.55 | | 150 day DMA | 21.97 | | 200 day DMA | 21.05 | EMA (exponential moving average) of Ks Em KEMQ
| EMA period | EMA current | EMA prev | EMA prev2 | | 5 day EMA | 26.12 | 26.09 | 26.19 | | 12 day EMA | 26.19 | 26.19 | 26.24 | | 20 day EMA | 26.1 | 26.09 | 26.11 | | 35 day EMA | 25.58 | 25.54 | 25.52 | | 50 day EMA | 25.02 | 24.97 | 24.93 |
SMA (simple moving average) of Ks Em KEMQ
| SMA period | SMA current | SMA prev | SMA prev2 | | 5 day SMA | 26.14 | 26.1 | 26.08 | | 12 day SMA | 26.3 | 26.38 | 26.45 | | 20 day SMA | 26.34 | 26.35 | 26.39 | | 35 day SMA | 25.83 | 25.75 | 25.69 | | 50 day SMA | 25.11 | 25.03 | 24.97 | | 100 day SMA | 23.55 | 23.49 | 23.44 | | 150 day SMA | 21.97 | 21.93 | 21.89 | | 200 day SMA | 21.05 | 21.01 | 20.96 |
|
|
