AdasinaSocial JSTC full analysis,charts,indicators,moving averages,SMA,DMA,EMA,ADX,MACD,RSIAdasina Social JSTC WideScreen charts, DMA,SMA,EMA technical analysis, forecast prediction, by indicators ADX,MACD,RSI,CCI AMEX stock exchange
Daily price and charts and targets AdasinaSocial Strong Daily Stock price targets for AdasinaSocial JSTC are 20.37 and 20.5 | Daily Target 1 | 20.26 | | Daily Target 2 | 20.35 | | Daily Target 3 | 20.393333333333 | | Daily Target 4 | 20.48 | | Daily Target 5 | 20.52 |
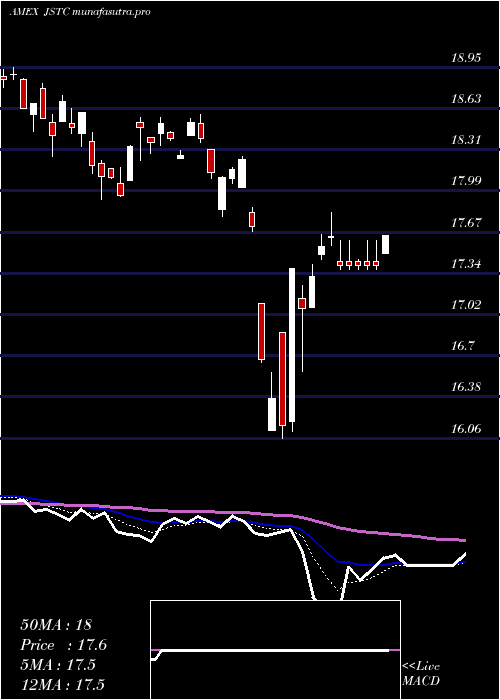
Daily price and volume Adasina Social
| Date |
Closing |
Open |
Range |
Volume |
Thu 23 October 2025 |
20.43 (0.69%) |
20.38 |
20.31 - 20.44 |
0.2788 times |
Wed 22 October 2025 |
20.29 (-0.73%) |
20.40 |
20.17 - 20.48 |
0.2253 times |
Tue 21 October 2025 |
20.44 (0.2%) |
20.36 |
20.36 - 20.48 |
1.1224 times |
Mon 20 October 2025 |
20.40 (0.84%) |
20.29 |
20.29 - 20.41 |
0.3449 times |
Fri 17 October 2025 |
20.23 (0.4%) |
20.03 |
20.03 - 20.23 |
0.7431 times |
Thu 16 October 2025 |
20.15 (-0.3%) |
20.43 |
20.06 - 20.45 |
0.3849 times |
Wed 15 October 2025 |
20.21 (-0.2%) |
20.43 |
20.17 - 20.44 |
5.2742 times |
Tue 14 October 2025 |
20.25 (0.2%) |
20.05 |
20.05 - 20.33 |
0.0542 times |
Mon 13 October 2025 |
20.21 (1.3%) |
20.14 |
20.10 - 20.26 |
1.1256 times |
Fri 10 October 2025 |
19.95 (-2.16%) |
20.40 |
19.94 - 20.45 |
0.4464 times |
Thu 09 October 2025 |
20.39 (-0.68%) |
20.53 |
20.33 - 20.53 |
1.352 times |
Weekly price and charts AdasinaSocial Strong weekly Stock price targets for AdasinaSocial JSTC are 20.3 and 20.61 | Weekly Target 1 | 20.05 | | Weekly Target 2 | 20.24 | | Weekly Target 3 | 20.36 | | Weekly Target 4 | 20.55 | | Weekly Target 5 | 20.67 |
Weekly price and volumes for Adasina Social
| Date |
Closing |
Open |
Range |
Volume |
Thu 23 October 2025 |
20.43 (0.99%) |
20.29 |
20.17 - 20.48 |
0.7688 times |
Fri 17 October 2025 |
20.23 (1.4%) |
20.14 |
20.03 - 20.45 |
2.9567 times |
Fri 10 October 2025 |
19.95 (-2.73%) |
20.64 |
19.94 - 20.64 |
1.486 times |
Fri 03 October 2025 |
20.51 (1.94%) |
20.26 |
20.15 - 20.61 |
0.6441 times |
Fri 26 September 2025 |
20.12 (-1.32%) |
20.29 |
19.95 - 20.48 |
0.955 times |
Fri 19 September 2025 |
20.39 (0.39%) |
20.35 |
20.17 - 20.50 |
0.5484 times |
Fri 12 September 2025 |
20.31 (0.59%) |
20.27 |
20.21 - 20.46 |
0.7548 times |
Fri 05 September 2025 |
20.19 (0.2%) |
19.96 |
19.88 - 20.31 |
0.4849 times |
Fri 29 August 2025 |
20.15 (0%) |
20.27 |
20.15 - 20.27 |
0.0696 times |
Fri 29 August 2025 |
20.15 (-0.98%) |
20.33 |
20.11 - 20.33 |
1.3317 times |
Fri 22 August 2025 |
20.35 (1.24%) |
20.11 |
20.03 - 20.45 |
0.2947 times |

Monthly price and charts AdasinaSocial Strong monthly Stock price targets for AdasinaSocial JSTC are 20.19 and 20.89 | Monthly Target 1 | 19.64 | | Monthly Target 2 | 20.03 | | Monthly Target 3 | 20.336666666667 | | Monthly Target 4 | 20.73 | | Monthly Target 5 | 21.04 |
Monthly price and volumes Adasina Social
| Date |
Closing |
Open |
Range |
Volume |
Thu 23 October 2025 |
20.43 (0.49%) |
20.38 |
19.94 - 20.64 |
0.7895 times |
Tue 30 September 2025 |
20.33 (0.89%) |
19.96 |
19.88 - 20.50 |
0.4572 times |
Fri 29 August 2025 |
20.15 (2.91%) |
19.49 |
19.33 - 20.45 |
0.9312 times |
Thu 31 July 2025 |
19.58 (-1.06%) |
19.75 |
19.55 - 20.16 |
1.408 times |
Mon 30 June 2025 |
19.79 (3.13%) |
19.15 |
19.10 - 19.79 |
1.8846 times |
Fri 30 May 2025 |
19.19 (4.18%) |
18.47 |
18.38 - 19.44 |
1.0309 times |
Wed 30 April 2025 |
18.42 (1.82%) |
18.08 |
16.06 - 18.42 |
0.5419 times |
Mon 31 March 2025 |
18.09 (-3.11%) |
18.78 |
17.79 - 18.82 |
1.0999 times |
Fri 28 February 2025 |
18.67 (-0.27%) |
18.50 |
18.39 - 19.20 |
0.7479 times |
Fri 31 January 2025 |
18.72 (1.96%) |
18.39 |
18.01 - 19.18 |
1.1088 times |
Tue 31 December 2024 |
18.36 (-4.77%) |
19.54 |
18.29 - 19.54 |
1.0274 times |

DMA SMA EMA moving averages of Adasina Social JSTC
DMA (daily moving average) of Adasina Social JSTC
| DMA period | DMA value | | 5 day DMA | 20.36 | | 12 day DMA | 20.29 | | 20 day DMA | 20.32 | | 35 day DMA | 20.3 | | 50 day DMA | 20.25 | | 100 day DMA | 19.96 | | 150 day DMA | 19.39 | | 200 day DMA | 19.21 | EMA (exponential moving average) of Adasina Social JSTC
| EMA period | EMA current | EMA prev | EMA prev2 | | 5 day EMA | 20.36 | 20.32 | 20.33 | | 12 day EMA | 20.32 | 20.3 | 20.3 | | 20 day EMA | 20.3 | 20.29 | 20.29 | | 35 day EMA | 20.28 | 20.27 | 20.27 | | 50 day EMA | 20.24 | 20.23 | 20.23 |
SMA (simple moving average) of Adasina Social JSTC
| SMA period | SMA current | SMA prev | SMA prev2 | | 5 day SMA | 20.36 | 20.3 | 20.29 | | 12 day SMA | 20.29 | 20.28 | 20.3 | | 20 day SMA | 20.32 | 20.3 | 20.29 | | 35 day SMA | 20.3 | 20.29 | 20.28 | | 50 day SMA | 20.25 | 20.25 | 20.24 | | 100 day SMA | 19.96 | 19.95 | 19.94 | | 150 day SMA | 19.39 | 19.38 | 19.37 | | 200 day SMA | 19.21 | 19.2 | 19.19 |
|
|
