GeneralEmployment JOB full analysis,charts,indicators,moving averages,SMA,DMA,EMA,ADX,MACD,RSIGeneral Employment JOB WideScreen charts, DMA,SMA,EMA technical analysis, forecast prediction, by indicators ADX,MACD,RSI,CCI AMEX stock exchange
Daily price and charts and targets GeneralEmployment Strong Daily Stock price targets for GeneralEmployment JOB are 0.2 and 0.23 | Daily Target 1 | 0.17 | | Daily Target 2 | 0.19 | | Daily Target 3 | 0.2 | | Daily Target 4 | 0.22 | | Daily Target 5 | 0.23 |
Daily price and volume General Employment
| Date |
Closing |
Open |
Range |
Volume |
Thu 23 October 2025 |
0.21 (0%) |
0.21 |
0.18 - 0.21 |
0.6136 times |
Wed 22 October 2025 |
0.21 (0%) |
0.21 |
0.20 - 0.21 |
0.7156 times |
Tue 21 October 2025 |
0.21 (5%) |
0.20 |
0.20 - 0.21 |
0.8006 times |
Mon 20 October 2025 |
0.20 (0%) |
0.20 |
0.20 - 0.21 |
0.8761 times |
Fri 17 October 2025 |
0.20 (-4.76%) |
0.20 |
0.20 - 0.21 |
0.8605 times |
Thu 16 October 2025 |
0.21 (5%) |
0.21 |
0.20 - 0.21 |
1.1661 times |
Wed 15 October 2025 |
0.20 (0%) |
0.20 |
0.20 - 0.21 |
1.0406 times |
Tue 14 October 2025 |
0.20 (0%) |
0.20 |
0.20 - 0.21 |
1.0498 times |
Mon 13 October 2025 |
0.20 (-4.76%) |
0.20 |
0.20 - 0.21 |
0.9957 times |
Tue 07 October 2025 |
0.21 (0%) |
0.21 |
0.21 - 0.21 |
1.8815 times |
Mon 06 October 2025 |
0.21 (0%) |
0.22 |
0.21 - 0.22 |
1.8009 times |
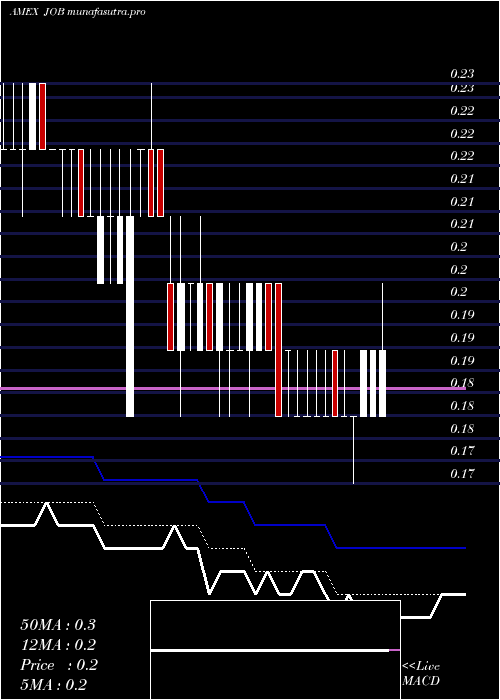
Weekly price and charts GeneralEmployment Strong weekly Stock price targets for GeneralEmployment JOB are 0.2 and 0.23 | Weekly Target 1 | 0.17 | | Weekly Target 2 | 0.19 | | Weekly Target 3 | 0.2 | | Weekly Target 4 | 0.22 | | Weekly Target 5 | 0.23 |
Weekly price and volumes for General Employment
| Date |
Closing |
Open |
Range |
Volume |
Thu 23 October 2025 |
0.21 (5%) |
0.20 |
0.18 - 0.21 |
0.4999 times |
Fri 17 October 2025 |
0.20 (-4.76%) |
0.20 |
0.20 - 0.21 |
0.8503 times |
Tue 07 October 2025 |
0.21 (0%) |
0.22 |
0.21 - 0.22 |
0.6124 times |
Fri 03 October 2025 |
0.21 (0%) |
0.21 |
0.21 - 0.21 |
1.152 times |
Fri 26 September 2025 |
0.21 (0%) |
0.22 |
0.19 - 0.22 |
1.4723 times |
Fri 19 September 2025 |
0.21 (0%) |
0.22 |
0.20 - 0.22 |
1.4024 times |
Fri 12 September 2025 |
0.21 (10.53%) |
0.19 |
0.19 - 0.21 |
1.2012 times |
Fri 05 September 2025 |
0.19 (-5%) |
0.20 |
0.19 - 0.20 |
0.7028 times |
Fri 29 August 2025 |
0.20 (0%) |
0.20 |
0.19 - 0.20 |
0.7848 times |
Fri 29 August 2025 |
0.20 (0%) |
0.20 |
0.19 - 0.20 |
1.3219 times |
Fri 22 August 2025 |
0.20 (0%) |
0.20 |
0.19 - 0.21 |
0.7458 times |
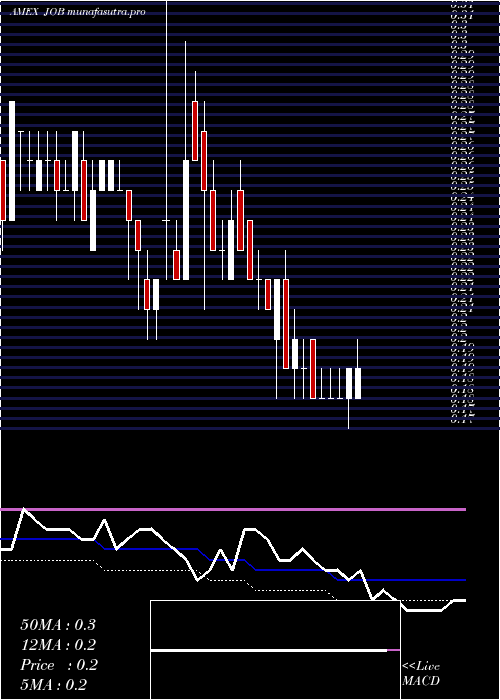
Monthly price and charts GeneralEmployment Strong monthly Stock price targets for GeneralEmployment JOB are 0.19 and 0.23 | Monthly Target 1 | 0.16 | | Monthly Target 2 | 0.19 | | Monthly Target 3 | 0.20333333333333 | | Monthly Target 4 | 0.23 | | Monthly Target 5 | 0.24 |
Monthly price and volumes General Employment
| Date |
Closing |
Open |
Range |
Volume |
Thu 23 October 2025 |
0.21 (0%) |
0.21 |
0.18 - 0.22 |
0.1025 times |
Tue 30 September 2025 |
0.21 (5%) |
0.20 |
0.19 - 0.22 |
0.2185 times |
Fri 29 August 2025 |
0.20 (0%) |
0.20 |
0.19 - 0.21 |
0.1826 times |
Thu 31 July 2025 |
0.20 (0%) |
0.20 |
0.19 - 0.24 |
0.1251 times |
Mon 30 June 2025 |
0.20 (5.26%) |
0.20 |
0.18 - 0.21 |
0.0854 times |
Fri 30 May 2025 |
0.19 (0%) |
0.19 |
0.18 - 0.21 |
0.1105 times |
Wed 30 April 2025 |
0.19 (-5%) |
0.20 |
0.17 - 0.21 |
0.1298 times |
Mon 31 March 2025 |
0.20 (-9.09%) |
0.22 |
0.18 - 0.23 |
0.1587 times |
Fri 28 February 2025 |
0.22 (-4.35%) |
0.23 |
0.22 - 0.26 |
0.2062 times |
Fri 31 January 2025 |
0.23 (9.52%) |
0.21 |
0.20 - 0.51 |
8.6808 times |
Tue 31 December 2024 |
0.21 (-19.23%) |
0.25 |
0.20 - 0.26 |
0.2768 times |

DMA SMA EMA moving averages of General Employment JOB
DMA (daily moving average) of General Employment JOB
| DMA period | DMA value | | 5 day DMA | 0.21 | | 12 day DMA | 0.21 | | 20 day DMA | 0.21 | | 35 day DMA | 0.2 | | 50 day DMA | 0.2 | | 100 day DMA | 0.2 | | 150 day DMA | 0.2 | | 200 day DMA | 0.21 | EMA (exponential moving average) of General Employment JOB
| EMA period | EMA current | EMA prev | EMA prev2 | | 5 day EMA | 0.2 | 0.2 | 0.2 | | 12 day EMA | 0.21 | 0.21 | 0.21 | | 20 day EMA | 0.2 | 0.2 | 0.2 | | 35 day EMA | 0.2 | 0.2 | 0.2 | | 50 day EMA | 0.2 | 0.2 | 0.2 |
SMA (simple moving average) of General Employment JOB
| SMA period | SMA current | SMA prev | SMA prev2 | | 5 day SMA | 0.21 | 0.21 | 0.2 | | 12 day SMA | 0.21 | 0.21 | 0.21 | | 20 day SMA | 0.21 | 0.21 | 0.21 | | 35 day SMA | 0.2 | 0.2 | 0.2 | | 50 day SMA | 0.2 | 0.2 | 0.2 | | 100 day SMA | 0.2 | 0.2 | 0.2 | | 150 day SMA | 0.2 | 0.2 | 0.2 | | 200 day SMA | 0.21 | 0.21 | 0.21 |
|
|
