JohnHancock JHMU full analysis,charts,indicators,moving averages,SMA,DMA,EMA,ADX,MACD,RSIJohn Hancock JHMU WideScreen charts, DMA,SMA,EMA technical analysis, forecast prediction, by indicators ADX,MACD,RSI,CCI AMEX stock exchange
Daily price and charts and targets JohnHancock Strong Daily Stock price targets for JohnHancock JHMU are 26.2 and 26.3 | Daily Target 1 | 26.18 | | Daily Target 2 | 26.22 | | Daily Target 3 | 26.28 | | Daily Target 4 | 26.32 | | Daily Target 5 | 26.38 |
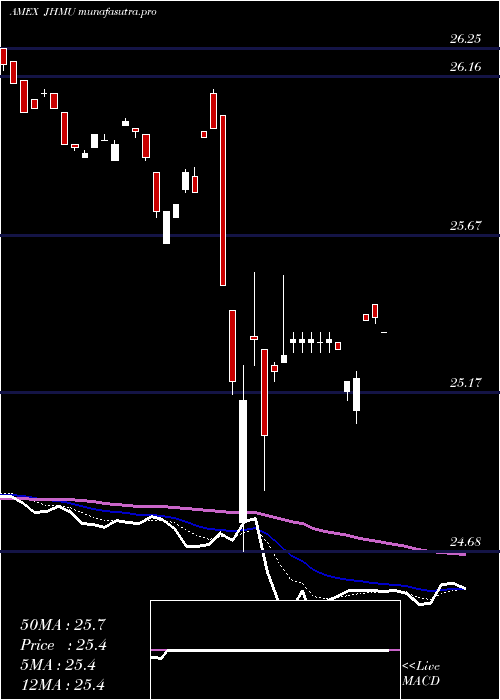
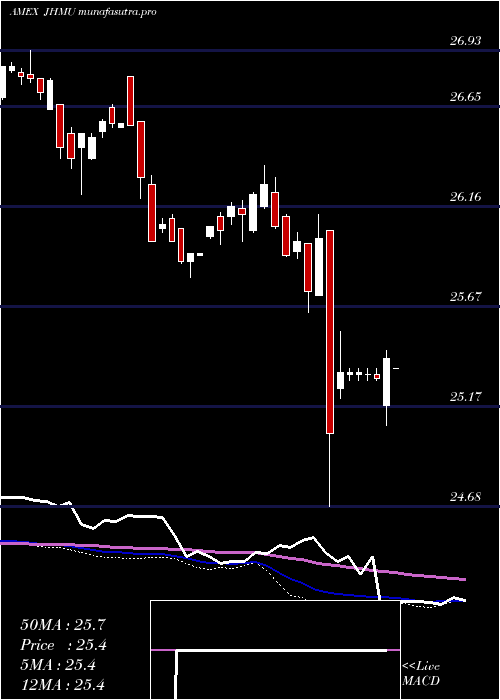
Daily price and volume John Hancock
| Date |
Closing |
Open |
Range |
Volume |
Thu 23 October 2025 |
26.26 (-0.11%) |
26.34 |
26.24 - 26.34 |
0.5352 times |
Wed 22 October 2025 |
26.29 (0.19%) |
26.30 |
26.28 - 26.30 |
0.2388 times |
Tue 21 October 2025 |
26.24 (-0.15%) |
26.31 |
26.24 - 26.31 |
3.4145 times |
Mon 20 October 2025 |
26.28 (0.23%) |
26.29 |
26.28 - 26.29 |
0.0345 times |
Fri 17 October 2025 |
26.22 (0.04%) |
26.23 |
26.22 - 26.23 |
0.347 times |
Thu 16 October 2025 |
26.21 (0%) |
26.19 |
26.19 - 26.21 |
0.9627 times |
Wed 15 October 2025 |
26.21 (0.34%) |
26.13 |
26.13 - 26.24 |
2.353 times |
Tue 14 October 2025 |
26.12 (-0.04%) |
26.12 |
26.12 - 26.13 |
0.0265 times |
Mon 13 October 2025 |
26.13 (0.11%) |
26.12 |
26.07 - 26.13 |
0.6546 times |
Fri 10 October 2025 |
26.10 (0.23%) |
26.04 |
26.04 - 26.10 |
1.433 times |
Thu 09 October 2025 |
26.04 (-0.04%) |
26.05 |
26.02 - 26.07 |
0.2654 times |
Weekly price and charts JohnHancock Strong weekly Stock price targets for JohnHancock JHMU are 26.2 and 26.3 | Weekly Target 1 | 26.18 | | Weekly Target 2 | 26.22 | | Weekly Target 3 | 26.28 | | Weekly Target 4 | 26.32 | | Weekly Target 5 | 26.38 |
Weekly price and volumes for John Hancock
| Date |
Closing |
Open |
Range |
Volume |
Thu 23 October 2025 |
26.26 (0.15%) |
26.29 |
26.24 - 26.34 |
1.0788 times |
Fri 17 October 2025 |
26.22 (0.46%) |
26.12 |
26.07 - 26.24 |
1.1097 times |
Fri 10 October 2025 |
26.10 (0.23%) |
26.01 |
26.01 - 26.10 |
0.7005 times |
Fri 03 October 2025 |
26.04 (0.39%) |
25.99 |
25.97 - 26.06 |
0.7114 times |
Fri 26 September 2025 |
25.94 (-0.54%) |
26.09 |
25.94 - 26.21 |
1.8711 times |
Fri 19 September 2025 |
26.08 (0.12%) |
26.11 |
26.04 - 26.19 |
0.2079 times |
Fri 12 September 2025 |
26.05 (1.05%) |
25.87 |
25.86 - 26.06 |
1.1502 times |
Fri 05 September 2025 |
25.78 (0.9%) |
25.54 |
25.47 - 25.78 |
0.7932 times |
Fri 29 August 2025 |
25.55 (0%) |
25.56 |
25.55 - 25.64 |
0.1333 times |
Fri 29 August 2025 |
25.55 (-0.16%) |
25.58 |
25.51 - 25.64 |
2.2439 times |
Fri 22 August 2025 |
25.59 (0.43%) |
25.69 |
25.47 - 25.69 |
1.4779 times |
Monthly price and charts JohnHancock Strong monthly Stock price targets for JohnHancock JHMU are 26.14 and 26.47 | Monthly Target 1 | 25.87 | | Monthly Target 2 | 26.07 | | Monthly Target 3 | 26.203333333333 | | Monthly Target 4 | 26.4 | | Monthly Target 5 | 26.53 |
Monthly price and volumes John Hancock
| Date |
Closing |
Open |
Range |
Volume |
Thu 23 October 2025 |
26.26 (0.96%) |
26.05 |
26.01 - 26.34 |
1.0475 times |
Tue 30 September 2025 |
26.01 (1.8%) |
25.54 |
25.47 - 26.21 |
1.3991 times |
Fri 29 August 2025 |
25.55 (0.79%) |
25.49 |
25.40 - 25.69 |
1.3729 times |
Thu 31 July 2025 |
25.35 (-0.78%) |
25.55 |
25.27 - 25.59 |
1.1199 times |
Mon 30 June 2025 |
25.55 (0.71%) |
25.34 |
25.29 - 25.57 |
0.8674 times |
Fri 30 May 2025 |
25.37 (-0.55%) |
25.56 |
25.31 - 25.62 |
0.8848 times |
Wed 30 April 2025 |
25.51 (-0.97%) |
25.81 |
24.68 - 26.12 |
0.8172 times |
Mon 31 March 2025 |
25.76 (-1.94%) |
26.23 |
25.64 - 26.30 |
1.3909 times |
Fri 28 February 2025 |
26.27 (0.88%) |
26.11 |
25.99 - 26.36 |
0.7412 times |
Fri 31 January 2025 |
26.04 (0.04%) |
26.07 |
25.81 - 26.13 |
0.359 times |
Tue 31 December 2024 |
26.03 (-2.03%) |
26.80 |
25.99 - 26.80 |
0.5177 times |

DMA SMA EMA moving averages of John Hancock JHMU
DMA (daily moving average) of John Hancock JHMU
| DMA period | DMA value | | 5 day DMA | 26.26 | | 12 day DMA | 26.18 | | 20 day DMA | 26.11 | | 35 day DMA | 26.07 | | 50 day DMA | 25.91 | | 100 day DMA | 25.69 | | 150 day DMA | 25.62 | | 200 day DMA | 25.73 | EMA (exponential moving average) of John Hancock JHMU
| EMA period | EMA current | EMA prev | EMA prev2 | | 5 day EMA | 26.25 | 26.24 | 26.22 | | 12 day EMA | 26.19 | 26.18 | 26.16 | | 20 day EMA | 26.14 | 26.13 | 26.11 | | 35 day EMA | 26.01 | 26 | 25.98 | | 50 day EMA | 25.91 | 25.9 | 25.88 |
SMA (simple moving average) of John Hancock JHMU
| SMA period | SMA current | SMA prev | SMA prev2 | | 5 day SMA | 26.26 | 26.25 | 26.23 | | 12 day SMA | 26.18 | 26.16 | 26.14 | | 20 day SMA | 26.11 | 26.1 | 26.09 | | 35 day SMA | 26.07 | 26.05 | 26.03 | | 50 day SMA | 25.91 | 25.9 | 25.88 | | 100 day SMA | 25.69 | 25.68 | 25.67 | | 150 day SMA | 25.62 | 25.61 | 25.61 | | 200 day SMA | 25.73 | 25.73 | 25.73 |
|
|
