JpmorganEquity JEPI full analysis,charts,indicators,moving averages,SMA,DMA,EMA,ADX,MACD,RSIJpmorgan Equity JEPI WideScreen charts, DMA,SMA,EMA technical analysis, forecast prediction, by indicators ADX,MACD,RSI,CCI AMEX stock exchange
Daily price and charts and targets JpmorganEquity Strong Daily Stock price targets for JpmorganEquity JEPI are 57.35 and 57.66 | Daily Target 1 | 57.1 | | Daily Target 2 | 57.28 | | Daily Target 3 | 57.406666666667 | | Daily Target 4 | 57.59 | | Daily Target 5 | 57.72 |
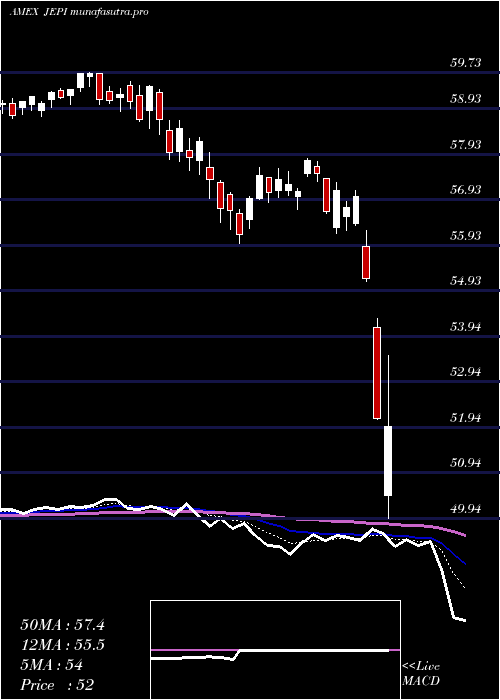
Daily price and volume Jpmorgan Equity
| Date |
Closing |
Open |
Range |
Volume |
Thu 23 October 2025 |
57.47 (0.3%) |
57.29 |
57.22 - 57.53 |
0.7326 times |
Wed 22 October 2025 |
57.30 (-0.38%) |
57.46 |
57.21 - 57.58 |
1.6308 times |
Tue 21 October 2025 |
57.52 (0.59%) |
57.22 |
57.22 - 57.58 |
0.8979 times |
Mon 20 October 2025 |
57.18 (0.56%) |
57.00 |
56.84 - 57.23 |
0.7381 times |
Fri 17 October 2025 |
56.86 (0.62%) |
56.50 |
56.02 - 56.90 |
0.8259 times |
Thu 16 October 2025 |
56.51 (-0.63%) |
57.05 |
56.29 - 57.06 |
0.841 times |
Wed 15 October 2025 |
56.87 (-0.02%) |
56.94 |
56.52 - 57.21 |
0.9524 times |
Tue 14 October 2025 |
56.88 (0.58%) |
56.26 |
56.19 - 57.03 |
1.1148 times |
Mon 13 October 2025 |
56.55 (0.98%) |
56.28 |
56.24 - 56.68 |
1.1556 times |
Fri 10 October 2025 |
56.00 (-1.32%) |
56.82 |
55.98 - 56.93 |
1.1111 times |
Thu 09 October 2025 |
56.75 (-0.28%) |
56.92 |
56.71 - 56.99 |
0.8087 times |
Weekly price and charts JpmorganEquity Strong weekly Stock price targets for JpmorganEquity JEPI are 57.16 and 57.9 | Weekly Target 1 | 56.56 | | Weekly Target 2 | 57.01 | | Weekly Target 3 | 57.296666666667 | | Weekly Target 4 | 57.75 | | Weekly Target 5 | 58.04 |
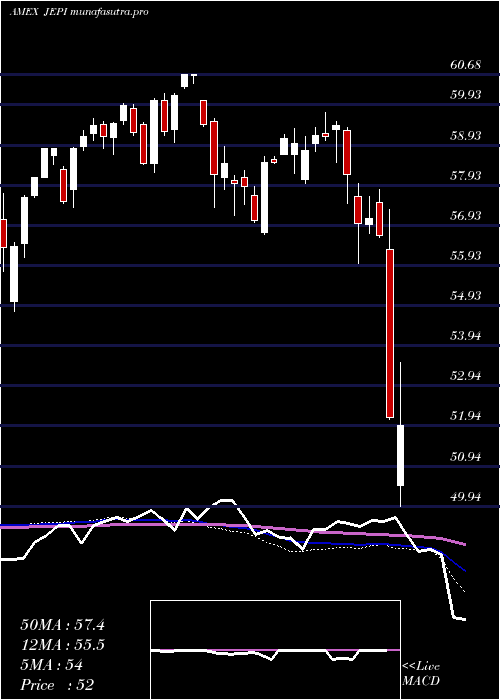
Weekly price and volumes for Jpmorgan Equity
| Date |
Closing |
Open |
Range |
Volume |
Thu 23 October 2025 |
57.47 (1.07%) |
57.00 |
56.84 - 57.58 |
1.0366 times |
Fri 17 October 2025 |
56.86 (1.54%) |
56.28 |
56.02 - 57.21 |
1.2673 times |
Fri 10 October 2025 |
56.00 (-1.81%) |
57.02 |
55.98 - 57.04 |
1.1456 times |
Fri 03 October 2025 |
57.03 (0.16%) |
57.07 |
56.67 - 57.14 |
1.2569 times |
Fri 26 September 2025 |
56.94 (0.14%) |
56.78 |
56.52 - 56.97 |
1.202 times |
Fri 19 September 2025 |
56.86 (-0.07%) |
56.91 |
56.72 - 57.10 |
1.0937 times |
Fri 12 September 2025 |
56.90 (0.21%) |
56.79 |
56.56 - 57.26 |
0.9628 times |
Fri 05 September 2025 |
56.78 (-0.65%) |
56.49 |
56.28 - 57.03 |
0.904 times |
Fri 29 August 2025 |
57.15 (0%) |
57.22 |
57.02 - 57.28 |
0.2047 times |
Fri 29 August 2025 |
57.15 (-0.38%) |
57.31 |
56.93 - 57.34 |
0.9265 times |
Fri 22 August 2025 |
57.37 (1.2%) |
56.65 |
56.65 - 57.50 |
0.8726 times |
Monthly price and charts JpmorganEquity Strong monthly Stock price targets for JpmorganEquity JEPI are 56.73 and 58.33 | Monthly Target 1 | 55.41 | | Monthly Target 2 | 56.44 | | Monthly Target 3 | 57.01 | | Monthly Target 4 | 58.04 | | Monthly Target 5 | 58.61 |
Monthly price and volumes Jpmorgan Equity
| Date |
Closing |
Open |
Range |
Volume |
Thu 23 October 2025 |
57.47 (0.65%) |
56.70 |
55.98 - 57.58 |
0.9135 times |
Tue 30 September 2025 |
57.10 (-0.09%) |
56.49 |
56.28 - 57.26 |
1.0144 times |
Fri 29 August 2025 |
57.15 (1.19%) |
55.86 |
55.45 - 57.50 |
0.9023 times |
Thu 31 July 2025 |
56.48 (-0.65%) |
56.49 |
56.26 - 57.35 |
1.0081 times |
Mon 30 June 2025 |
56.85 (1.35%) |
55.48 |
55.15 - 56.85 |
0.9135 times |
Fri 30 May 2025 |
56.09 (0.9%) |
55.51 |
55.01 - 56.38 |
1.1323 times |
Wed 30 April 2025 |
55.59 (-2.71%) |
56.56 |
49.94 - 57.13 |
1.4537 times |
Mon 31 March 2025 |
57.14 (-3.82%) |
59.28 |
55.97 - 59.36 |
0.8877 times |
Fri 28 February 2025 |
59.41 (0.75%) |
58.07 |
57.97 - 59.73 |
0.8431 times |
Fri 31 January 2025 |
58.97 (2.5%) |
57.85 |
56.71 - 59.35 |
0.9315 times |
Tue 31 December 2024 |
57.53 (-5.19%) |
60.03 |
57.35 - 60.03 |
0.6014 times |

DMA SMA EMA moving averages of Jpmorgan Equity JEPI
DMA (daily moving average) of Jpmorgan Equity JEPI
| DMA period | DMA value | | 5 day DMA | 57.27 | | 12 day DMA | 56.9 | | 20 day DMA | 56.92 | | 35 day DMA | 56.89 | | 50 day DMA | 56.91 | | 100 day DMA | 56.69 | | 150 day DMA | 56.21 | | 200 day DMA | 56.77 | EMA (exponential moving average) of Jpmorgan Equity JEPI
| EMA period | EMA current | EMA prev | EMA prev2 | | 5 day EMA | 57.26 | 57.16 | 57.09 | | 12 day EMA | 57.06 | 56.98 | 56.92 | | 20 day EMA | 56.99 | 56.94 | 56.9 | | 35 day EMA | 56.9 | 56.87 | 56.84 | | 50 day EMA | 56.9 | 56.88 | 56.86 |
SMA (simple moving average) of Jpmorgan Equity JEPI
| SMA period | SMA current | SMA prev | SMA prev2 | | 5 day SMA | 57.27 | 57.07 | 56.99 | | 12 day SMA | 56.9 | 56.85 | 56.82 | | 20 day SMA | 56.92 | 56.88 | 56.86 | | 35 day SMA | 56.89 | 56.87 | 56.85 | | 50 day SMA | 56.91 | 56.9 | 56.88 | | 100 day SMA | 56.69 | 56.68 | 56.66 | | 150 day SMA | 56.21 | 56.21 | 56.21 | | 200 day SMA | 56.77 | 56.77 | 56.77 |
|
|
