SP IXN full analysis,charts,indicators,moving averages,SMA,DMA,EMA,ADX,MACD,RSIS P IXN WideScreen charts, DMA,SMA,EMA technical analysis, forecast prediction, by indicators ADX,MACD,RSI,CCI AMEX stock exchange
Daily price and charts and targets SP Strong Daily Stock price targets for SP IXN are 105.36 and 106.93 | Daily Target 1 | 104.09 | | Daily Target 2 | 105.06 | | Daily Target 3 | 105.65666666667 | | Daily Target 4 | 106.63 | | Daily Target 5 | 107.23 |
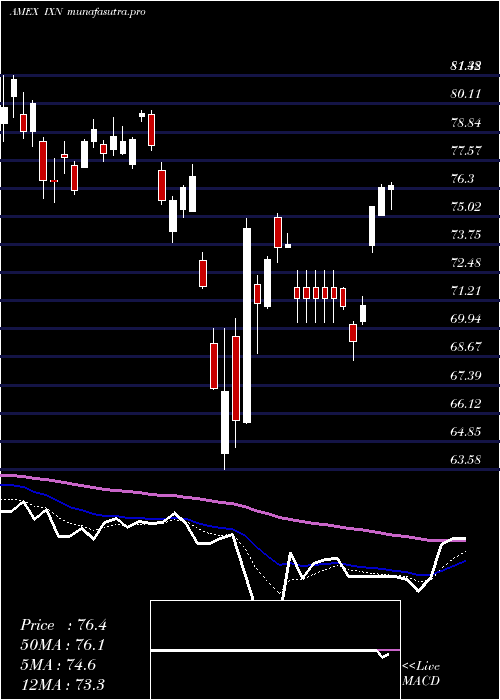
Daily price and volume S P
| Date |
Closing |
Open |
Range |
Volume |
Thu 23 October 2025 |
106.04 (1.02%) |
105.37 |
104.68 - 106.25 |
0.4947 times |
Wed 22 October 2025 |
104.97 (-0.73%) |
105.74 |
103.74 - 106.10 |
1.1218 times |
Tue 21 October 2025 |
105.74 (-0.36%) |
105.85 |
105.40 - 106.19 |
0.5203 times |
Mon 20 October 2025 |
106.12 (1.23%) |
105.59 |
105.59 - 106.63 |
1.3413 times |
Fri 17 October 2025 |
104.83 (0.11%) |
104.00 |
103.58 - 105.20 |
0.7661 times |
Thu 16 October 2025 |
104.72 (0.35%) |
105.31 |
103.96 - 105.77 |
1.4914 times |
Wed 15 October 2025 |
104.35 (1.14%) |
105.07 |
103.21 - 105.27 |
1.4319 times |
Tue 14 October 2025 |
103.17 (-1.43%) |
103.16 |
102.05 - 104.22 |
0.7603 times |
Mon 13 October 2025 |
104.67 (-0.23%) |
104.33 |
103.92 - 104.99 |
1.3034 times |
Tue 07 October 2025 |
104.91 (-0.95%) |
106.20 |
104.71 - 106.42 |
0.7688 times |
Mon 06 October 2025 |
105.92 (1.05%) |
105.77 |
105.66 - 106.37 |
0.4574 times |
Weekly price and charts SP Strong weekly Stock price targets for SP IXN are 104.89 and 107.78 | Weekly Target 1 | 102.58 | | Weekly Target 2 | 104.31 | | Weekly Target 3 | 105.47 | | Weekly Target 4 | 107.2 | | Weekly Target 5 | 108.36 |
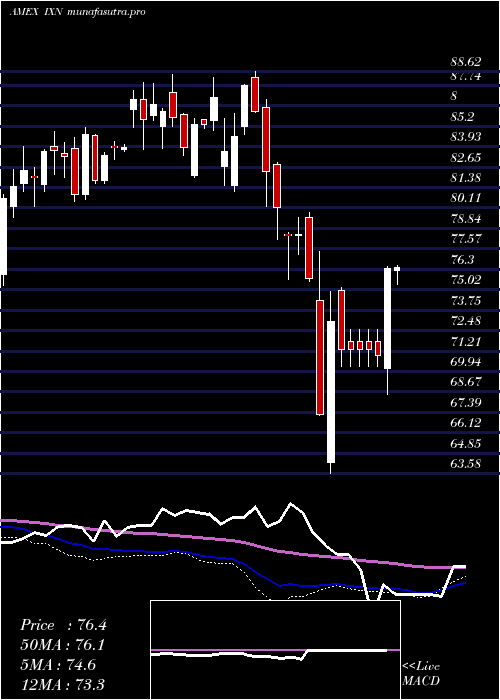
Weekly price and volumes for S P
| Date |
Closing |
Open |
Range |
Volume |
Thu 23 October 2025 |
106.04 (1.15%) |
105.59 |
103.74 - 106.63 |
0.9462 times |
Fri 17 October 2025 |
104.83 (-0.08%) |
104.33 |
102.05 - 105.77 |
1.565 times |
Tue 07 October 2025 |
104.91 (0.09%) |
105.77 |
104.71 - 106.42 |
0.3335 times |
Fri 03 October 2025 |
104.82 (3.08%) |
102.15 |
102.07 - 105.65 |
1.0444 times |
Fri 26 September 2025 |
101.69 (0.08%) |
101.62 |
100.41 - 103.45 |
1.3147 times |
Fri 19 September 2025 |
101.61 (2.56%) |
99.23 |
98.26 - 101.86 |
1.0016 times |
Fri 12 September 2025 |
99.07 (3.72%) |
96.07 |
96.07 - 99.27 |
2.3032 times |
Fri 05 September 2025 |
95.52 (0.06%) |
93.70 |
93.27 - 96.51 |
0.5854 times |
Fri 29 August 2025 |
95.46 (0%) |
96.59 |
95.25 - 96.59 |
0.1488 times |
Fri 29 August 2025 |
95.46 (-0.4%) |
95.74 |
95.25 - 97.42 |
0.7574 times |
Fri 22 August 2025 |
95.84 (-1.31%) |
97.02 |
93.51 - 97.55 |
1.3218 times |
Monthly price and charts SP Strong monthly Stock price targets for SP IXN are 104.05 and 108.63 | Monthly Target 1 | 100.33 | | Monthly Target 2 | 103.18 | | Monthly Target 3 | 104.90666666667 | | Monthly Target 4 | 107.76 | | Monthly Target 5 | 109.49 |
Monthly price and volumes S P
| Date |
Closing |
Open |
Range |
Volume |
Thu 23 October 2025 |
106.04 (2.74%) |
102.80 |
102.05 - 106.63 |
0.4964 times |
Tue 30 September 2025 |
103.21 (8.12%) |
93.70 |
93.27 - 103.45 |
0.8318 times |
Fri 29 August 2025 |
95.46 (-0.43%) |
94.92 |
93.51 - 98.80 |
0.6219 times |
Thu 31 July 2025 |
95.87 (3.82%) |
91.91 |
90.76 - 97.98 |
0.6444 times |
Mon 30 June 2025 |
92.34 (9.86%) |
83.87 |
83.87 - 92.52 |
0.6275 times |
Fri 30 May 2025 |
84.05 (9.33%) |
78.57 |
77.93 - 85.74 |
0.7145 times |
Wed 30 April 2025 |
76.88 (1.51%) |
75.36 |
63.58 - 77.37 |
1.8596 times |
Mon 31 March 2025 |
75.74 (-8.08%) |
82.84 |
73.86 - 82.93 |
1.4959 times |
Fri 28 February 2025 |
82.40 (-1.48%) |
81.53 |
80.19 - 88.62 |
1.4142 times |
Fri 31 January 2025 |
83.64 (-1.31%) |
85.21 |
81.51 - 88.40 |
1.2938 times |
Tue 31 December 2024 |
84.75 (1.06%) |
86.25 |
83.74 - 87.89 |
0.4177 times |

DMA SMA EMA moving averages of S P IXN
DMA (daily moving average) of S P IXN
| DMA period | DMA value | | 5 day DMA | 105.54 | | 12 day DMA | 105.02 | | 20 day DMA | 104.12 | | 35 day DMA | 101.63 | | 50 day DMA | 100.07 | | 100 day DMA | 95.79 | | 150 day DMA | 89.51 | | 200 day DMA | 88.07 | EMA (exponential moving average) of S P IXN
| EMA period | EMA current | EMA prev | EMA prev2 | | 5 day EMA | 105.47 | 105.18 | 105.29 | | 12 day EMA | 104.82 | 104.6 | 104.53 | | 20 day EMA | 103.91 | 103.69 | 103.56 | | 35 day EMA | 102.19 | 101.96 | 101.78 | | 50 day EMA | 100.31 | 100.08 | 99.88 |
SMA (simple moving average) of S P IXN
| SMA period | SMA current | SMA prev | SMA prev2 | | 5 day SMA | 105.54 | 105.28 | 105.15 | | 12 day SMA | 105.02 | 104.93 | 104.87 | | 20 day SMA | 104.12 | 103.98 | 103.82 | | 35 day SMA | 101.63 | 101.33 | 101.06 | | 50 day SMA | 100.07 | 99.88 | 99.73 | | 100 day SMA | 95.79 | 95.58 | 95.36 | | 150 day SMA | 89.51 | 89.33 | 89.15 | | 200 day SMA | 88.07 | 87.97 | 87.87 |
|
|
