RussellTop IWY full analysis,charts,indicators,moving averages,SMA,DMA,EMA,ADX,MACD,RSIRussell Top IWY WideScreen charts, DMA,SMA,EMA technical analysis, forecast prediction, by indicators ADX,MACD,RSI,CCI AMEX stock exchange
Daily price and charts and targets RussellTop Strong Daily Stock price targets for RussellTop IWY are 278.3 and 279.8 | Daily Target 1 | 277.18 | | Daily Target 2 | 277.92 | | Daily Target 3 | 278.67666666667 | | Daily Target 4 | 279.42 | | Daily Target 5 | 280.18 |
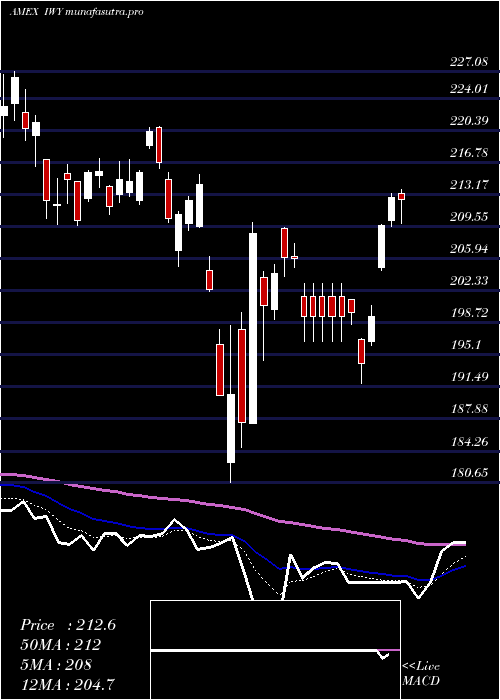
Daily price and volume Russell Top
| Date |
Closing |
Open |
Range |
Volume |
Fri 24 October 2025 |
278.67 (0.94%) |
278.16 |
277.93 - 279.43 |
0.6415 times |
Thu 23 October 2025 |
276.08 (0.78%) |
273.94 |
273.80 - 276.63 |
1.0531 times |
Wed 22 October 2025 |
273.94 (-0.71%) |
276.32 |
271.52 - 276.40 |
0.639 times |
Tue 21 October 2025 |
275.90 (-0.07%) |
276.16 |
275.12 - 276.55 |
0.6822 times |
Mon 20 October 2025 |
276.08 (1.15%) |
274.33 |
274.32 - 276.59 |
0.9497 times |
Fri 17 October 2025 |
272.93 (0.54%) |
270.03 |
269.61 - 273.59 |
1.0324 times |
Thu 16 October 2025 |
271.46 (-0.38%) |
273.58 |
269.53 - 274.68 |
1.553 times |
Wed 15 October 2025 |
272.50 (0.48%) |
274.05 |
270.00 - 274.84 |
1.1286 times |
Tue 14 October 2025 |
271.21 (-0.94%) |
270.81 |
268.00 - 273.16 |
1.3088 times |
Mon 13 October 2025 |
273.78 (-0.34%) |
273.04 |
272.00 - 274.35 |
1.0118 times |
Tue 07 October 2025 |
274.71 (-0.49%) |
276.54 |
273.92 - 276.85 |
3.4063 times |
Weekly price and charts RussellTop Strong weekly Stock price targets for RussellTop IWY are 275.1 and 283.01 | Weekly Target 1 | 268.63 | | Weekly Target 2 | 273.65 | | Weekly Target 3 | 276.54 | | Weekly Target 4 | 281.56 | | Weekly Target 5 | 284.45 |
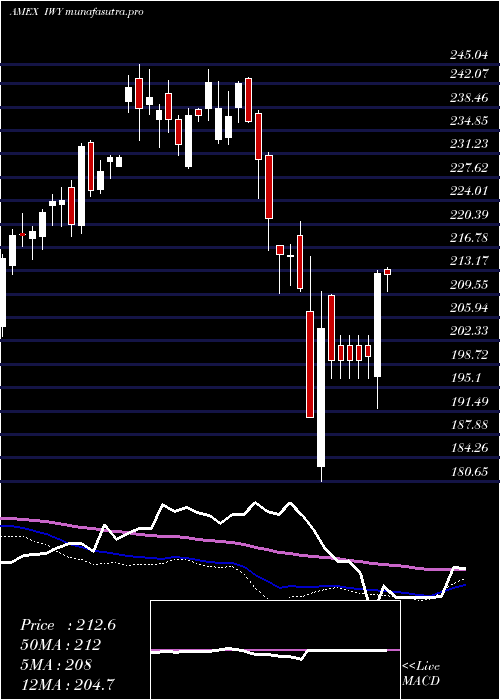
Weekly price and volumes for Russell Top
| Date |
Closing |
Open |
Range |
Volume |
Fri 24 October 2025 |
278.67 (2.1%) |
274.33 |
271.52 - 279.43 |
0.8239 times |
Fri 17 October 2025 |
272.93 (-0.65%) |
273.04 |
268.00 - 274.84 |
1.2539 times |
Tue 07 October 2025 |
274.71 (0.09%) |
274.47 |
273.92 - 276.85 |
0.974 times |
Fri 03 October 2025 |
274.46 (1.3%) |
272.10 |
270.99 - 276.81 |
1.2961 times |
Fri 26 September 2025 |
270.94 (-0.67%) |
272.60 |
268.00 - 275.72 |
2.3603 times |
Fri 19 September 2025 |
272.78 (1.97%) |
268.73 |
266.22 - 273.14 |
1.0998 times |
Fri 12 September 2025 |
267.51 (2.6%) |
262.12 |
261.62 - 268.02 |
0.7557 times |
Fri 05 September 2025 |
260.74 (0.9%) |
254.09 |
253.29 - 263.41 |
0.6212 times |
Fri 29 August 2025 |
258.41 (0%) |
260.54 |
257.50 - 260.54 |
0.1298 times |
Fri 29 August 2025 |
258.41 (0.02%) |
257.88 |
257.50 - 261.76 |
0.6852 times |
Fri 22 August 2025 |
258.35 (-1.01%) |
260.55 |
252.30 - 261.04 |
0.9606 times |
Monthly price and charts RussellTop Strong monthly Stock price targets for RussellTop IWY are 273.34 and 284.77 | Monthly Target 1 | 263.94 | | Monthly Target 2 | 271.3 | | Monthly Target 3 | 275.36666666667 | | Monthly Target 4 | 282.73 | | Monthly Target 5 | 286.8 |
Monthly price and volumes Russell Top
| Date |
Closing |
Open |
Range |
Volume |
Fri 24 October 2025 |
278.67 (1.83%) |
272.13 |
268.00 - 279.43 |
0.5451 times |
Tue 30 September 2025 |
273.65 (5.9%) |
254.09 |
253.29 - 275.72 |
0.7755 times |
Fri 29 August 2025 |
258.41 (1.11%) |
252.49 |
249.37 - 262.90 |
0.5476 times |
Thu 31 July 2025 |
255.57 (3.68%) |
245.54 |
243.08 - 259.98 |
0.7464 times |
Mon 30 June 2025 |
246.51 (6.31%) |
231.17 |
230.62 - 247.15 |
0.5813 times |
Fri 30 May 2025 |
231.88 (8.27%) |
217.93 |
214.29 - 235.00 |
0.9133 times |
Wed 30 April 2025 |
214.16 (1.53%) |
209.87 |
180.65 - 215.42 |
1.6256 times |
Mon 31 March 2025 |
210.94 (-8.45%) |
230.96 |
205.00 - 231.45 |
2.0158 times |
Fri 28 February 2025 |
230.40 (-3.31%) |
233.73 |
224.35 - 243.00 |
0.8551 times |
Fri 31 January 2025 |
238.29 (1.28%) |
236.07 |
228.96 - 244.34 |
1.3943 times |
Tue 31 December 2024 |
235.27 (1.96%) |
239.31 |
233.37 - 245.04 |
1.278 times |

DMA SMA EMA moving averages of Russell Top IWY
DMA (daily moving average) of Russell Top IWY
| DMA period | DMA value | | 5 day DMA | 276.13 | | 12 day DMA | 274.44 | | 20 day DMA | 273.83 | | 35 day DMA | 270.89 | | 50 day DMA | 267.25 | | 100 day DMA | 256.63 | | 150 day DMA | 242.25 | | 200 day DMA | 239.8 | EMA (exponential moving average) of Russell Top IWY
| EMA period | EMA current | EMA prev | EMA prev2 | | 5 day EMA | 276.16 | 274.9 | 274.31 | | 12 day EMA | 274.77 | 274.06 | 273.69 | | 20 day EMA | 273.46 | 272.91 | 272.58 | | 35 day EMA | 270.41 | 269.92 | 269.56 | | 50 day EMA | 267.43 | 266.97 | 266.6 |
SMA (simple moving average) of Russell Top IWY
| SMA period | SMA current | SMA prev | SMA prev2 | | 5 day SMA | 276.13 | 274.99 | 274.06 | | 12 day SMA | 274.44 | 274.09 | 274.05 | | 20 day SMA | 273.83 | 273.52 | 273.5 | | 35 day SMA | 270.89 | 270.24 | 269.74 | | 50 day SMA | 267.25 | 266.91 | 266.56 | | 100 day SMA | 256.63 | 256.17 | 255.73 | | 150 day SMA | 242.25 | 241.81 | 241.4 | | 200 day SMA | 239.8 | 239.61 | 239.42 |
|
|
