RussellTop IWX full analysis,charts,indicators,moving averages,SMA,DMA,EMA,ADX,MACD,RSIRussell Top IWX WideScreen charts, DMA,SMA,EMA technical analysis, forecast prediction, by indicators ADX,MACD,RSI,CCI AMEX stock exchange
Daily price and charts and targets RussellTop Strong Daily Stock price targets for RussellTop IWX are 88.61 and 88.99 | Daily Target 1 | 88.3 | | Daily Target 2 | 88.53 | | Daily Target 3 | 88.68 | | Daily Target 4 | 88.91 | | Daily Target 5 | 89.06 |
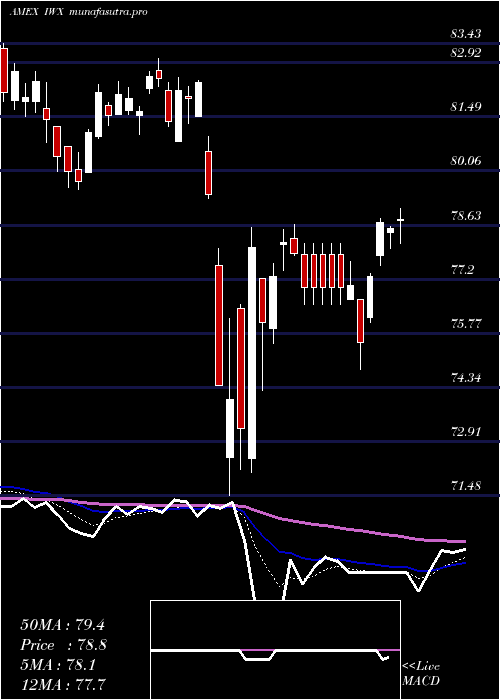
Daily price and volume Russell Top
| Date |
Closing |
Open |
Range |
Volume |
Thu 23 October 2025 |
88.76 (0.28%) |
88.57 |
88.45 - 88.83 |
0.5145 times |
Wed 22 October 2025 |
88.51 (-0.36%) |
88.76 |
88.20 - 88.81 |
0.5424 times |
Tue 21 October 2025 |
88.83 (0.02%) |
88.80 |
88.70 - 89.04 |
0.4629 times |
Mon 20 October 2025 |
88.81 (0.94%) |
88.33 |
88.24 - 88.88 |
1.7108 times |
Fri 17 October 2025 |
87.98 (0.57%) |
87.60 |
87.59 - 88.15 |
1.2282 times |
Thu 16 October 2025 |
87.48 (-0.87%) |
88.47 |
87.20 - 88.54 |
0.3459 times |
Wed 15 October 2025 |
88.25 (0.36%) |
88.23 |
87.56 - 88.83 |
3.5281 times |
Tue 14 October 2025 |
87.93 (0.68%) |
86.74 |
86.74 - 88.36 |
0.5696 times |
Mon 13 October 2025 |
87.34 (-1.2%) |
86.93 |
86.90 - 87.49 |
0.6327 times |
Tue 07 October 2025 |
88.40 (-0.2%) |
88.68 |
88.27 - 88.75 |
0.465 times |
Mon 06 October 2025 |
88.58 (0.18%) |
88.79 |
88.32 - 88.84 |
0.4018 times |
Weekly price and charts RussellTop Strong weekly Stock price targets for RussellTop IWX are 88.48 and 89.32 | Weekly Target 1 | 87.83 | | Weekly Target 2 | 88.29 | | Weekly Target 3 | 88.666666666667 | | Weekly Target 4 | 89.13 | | Weekly Target 5 | 89.51 |
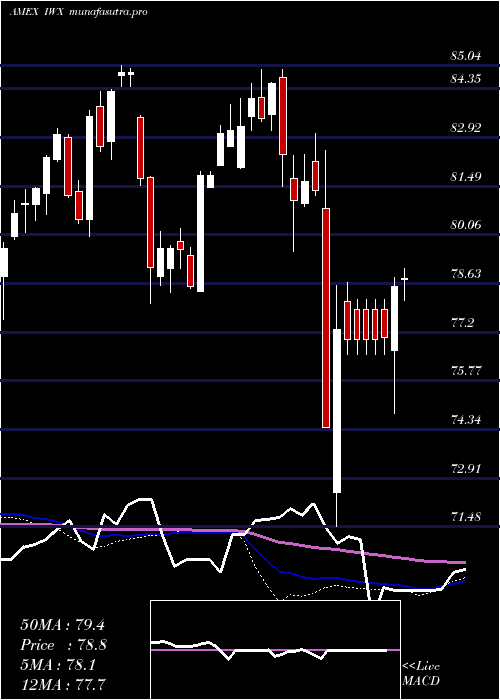
Weekly price and volumes for Russell Top
| Date |
Closing |
Open |
Range |
Volume |
Thu 23 October 2025 |
88.76 (0.89%) |
88.33 |
88.20 - 89.04 |
0.8267 times |
Fri 17 October 2025 |
87.98 (-0.48%) |
86.93 |
86.74 - 88.83 |
1.6134 times |
Tue 07 October 2025 |
88.40 (-0.02%) |
88.79 |
88.27 - 88.84 |
0.2218 times |
Fri 03 October 2025 |
88.42 (0.83%) |
87.66 |
87.39 - 88.80 |
1.6755 times |
Fri 26 September 2025 |
87.69 (0.03%) |
87.33 |
86.82 - 88.01 |
0.9901 times |
Fri 19 September 2025 |
87.66 (0.37%) |
87.52 |
86.78 - 87.88 |
1.2651 times |
Fri 12 September 2025 |
87.34 (0.7%) |
86.69 |
86.29 - 87.83 |
1.1459 times |
Fri 05 September 2025 |
86.73 (-0.25%) |
86.44 |
85.93 - 87.33 |
0.7296 times |
Fri 29 August 2025 |
86.95 (0%) |
86.85 |
86.70 - 87.06 |
0.2894 times |
Fri 29 August 2025 |
86.95 (0.12%) |
86.74 |
86.08 - 87.06 |
1.2426 times |
Fri 22 August 2025 |
86.85 (1.42%) |
85.58 |
85.48 - 87.02 |
0.7966 times |
Monthly price and charts RussellTop Strong monthly Stock price targets for RussellTop IWX are 87.75 and 90.05 | Monthly Target 1 | 85.88 | | Monthly Target 2 | 87.32 | | Monthly Target 3 | 88.18 | | Monthly Target 4 | 89.62 | | Monthly Target 5 | 90.48 |
Monthly price and volumes Russell Top
| Date |
Closing |
Open |
Range |
Volume |
Thu 23 October 2025 |
88.76 (1%) |
87.66 |
86.74 - 89.04 |
0.3155 times |
Tue 30 September 2025 |
87.88 (1.07%) |
86.44 |
85.93 - 88.01 |
0.3707 times |
Fri 29 August 2025 |
86.95 (3.33%) |
83.45 |
82.78 - 87.06 |
0.3281 times |
Thu 31 July 2025 |
84.15 (-0.05%) |
84.14 |
83.46 - 85.76 |
0.6331 times |
Mon 30 June 2025 |
84.19 (2.85%) |
81.59 |
81.17 - 84.29 |
0.4935 times |
Fri 30 May 2025 |
81.86 (3.03%) |
79.28 |
78.98 - 82.76 |
0.8254 times |
Wed 30 April 2025 |
79.45 (-3.32%) |
82.02 |
71.48 - 82.45 |
3.2455 times |
Mon 31 March 2025 |
82.18 (-2.73%) |
84.68 |
79.56 - 84.93 |
2.8804 times |
Fri 28 February 2025 |
84.49 (1.65%) |
82.04 |
82.00 - 84.92 |
0.5003 times |
Fri 31 January 2025 |
83.12 (5.18%) |
79.44 |
78.38 - 83.88 |
0.4076 times |
Tue 31 December 2024 |
79.03 (-6.84%) |
83.50 |
78.03 - 83.55 |
0.2569 times |

DMA SMA EMA moving averages of Russell Top IWX
DMA (daily moving average) of Russell Top IWX
| DMA period | DMA value | | 5 day DMA | 88.58 | | 12 day DMA | 88.27 | | 20 day DMA | 88.03 | | 35 day DMA | 87.64 | | 50 day DMA | 87.2 | | 100 day DMA | 85.47 | | 150 day DMA | 83.48 | | 200 day DMA | 83.2 | EMA (exponential moving average) of Russell Top IWX
| EMA period | EMA current | EMA prev | EMA prev2 | | 5 day EMA | 88.55 | 88.45 | 88.42 | | 12 day EMA | 88.29 | 88.2 | 88.14 | | 20 day EMA | 88.05 | 87.98 | 87.92 | | 35 day EMA | 87.56 | 87.49 | 87.43 | | 50 day EMA | 87.1 | 87.03 | 86.97 |
SMA (simple moving average) of Russell Top IWX
| SMA period | SMA current | SMA prev | SMA prev2 | | 5 day SMA | 88.58 | 88.32 | 88.27 | | 12 day SMA | 88.27 | 88.21 | 88.17 | | 20 day SMA | 88.03 | 87.97 | 87.93 | | 35 day SMA | 87.64 | 87.59 | 87.55 | | 50 day SMA | 87.2 | 87.11 | 87.03 | | 100 day SMA | 85.47 | 85.4 | 85.32 | | 150 day SMA | 83.48 | 83.44 | 83.39 | | 200 day SMA | 83.2 | 83.16 | 83.11 |
|
|
