Russell3000 IWV full analysis,charts,indicators,moving averages,SMA,DMA,EMA,ADX,MACD,RSIRussell 3000 IWV WideScreen charts, DMA,SMA,EMA technical analysis, forecast prediction, by indicators ADX,MACD,RSI,CCI AMEX stock exchange
Daily price and charts and targets Russell3000 Strong Daily Stock price targets for Russell3000 IWV are 384.03 and 387.03 | Daily Target 1 | 381.68 | | Daily Target 2 | 383.37 | | Daily Target 3 | 384.68 | | Daily Target 4 | 386.37 | | Daily Target 5 | 387.68 |
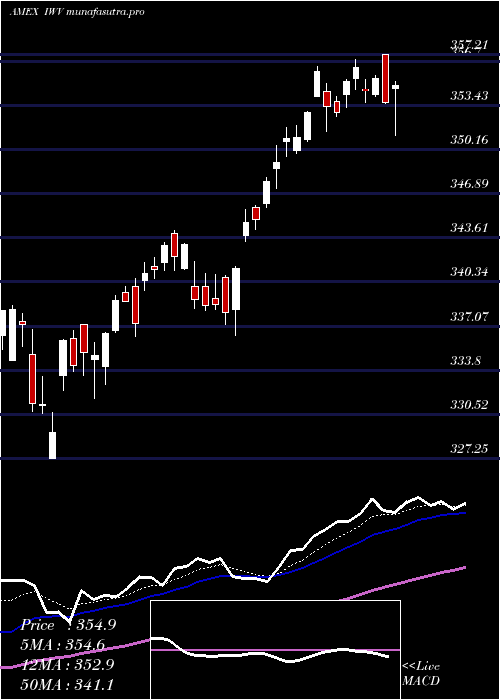
Daily price and volume Russell 3000
| Date |
Closing |
Open |
Range |
Volume |
Fri 24 October 2025 |
385.06 (0.77%) |
382.99 |
382.99 - 385.99 |
0.4577 times |
Thu 23 October 2025 |
382.12 (0.68%) |
379.82 |
379.82 - 382.64 |
0.3122 times |
Wed 22 October 2025 |
379.53 (-0.6%) |
382.29 |
377.09 - 382.29 |
0.434 times |
Tue 21 October 2025 |
381.82 (-0.03%) |
381.69 |
381.34 - 382.92 |
1.2368 times |
Mon 20 October 2025 |
381.94 (1.14%) |
379.50 |
379.50 - 382.37 |
0.4697 times |
Fri 17 October 2025 |
377.62 (0.42%) |
376.04 |
374.43 - 378.45 |
2.0702 times |
Thu 16 October 2025 |
376.05 (-0.75%) |
379.87 |
374.35 - 380.69 |
1.1643 times |
Wed 15 October 2025 |
378.89 (0.44%) |
380.11 |
375.74 - 381.81 |
1.0304 times |
Tue 14 October 2025 |
377.24 (-0.01%) |
374.04 |
371.68 - 379.09 |
1.2799 times |
Mon 13 October 2025 |
377.29 (1.61%) |
375.93 |
375.27 - 377.97 |
1.5448 times |
Fri 10 October 2025 |
371.33 (-2.68%) |
382.08 |
371.18 - 383.12 |
1.6716 times |
Weekly price and charts Russell3000 Strong weekly Stock price targets for Russell3000 IWV are 381.08 and 389.98 | Weekly Target 1 | 373.81 | | Weekly Target 2 | 379.44 | | Weekly Target 3 | 382.71333333333 | | Weekly Target 4 | 388.34 | | Weekly Target 5 | 391.61 |
Weekly price and volumes for Russell 3000
| Date |
Closing |
Open |
Range |
Volume |
Fri 24 October 2025 |
385.06 (1.97%) |
379.50 |
377.09 - 385.99 |
0.5285 times |
Fri 17 October 2025 |
377.62 (1.69%) |
375.93 |
371.68 - 381.81 |
1.2875 times |
Fri 10 October 2025 |
371.33 (-2.48%) |
380.75 |
371.18 - 383.30 |
2.17 times |
Fri 03 October 2025 |
380.77 (1.05%) |
378.10 |
376.26 - 382.83 |
1.2834 times |
Fri 26 September 2025 |
376.80 (-0.31%) |
377.55 |
372.40 - 380.18 |
0.8488 times |
Fri 19 September 2025 |
377.98 (0.95%) |
375.87 |
371.82 - 378.64 |
1.475 times |
Fri 12 September 2025 |
374.42 (1.46%) |
369.97 |
369.08 - 375.43 |
0.7872 times |
Fri 05 September 2025 |
369.04 (0.48%) |
362.97 |
361.94 - 371.75 |
0.3506 times |
Fri 29 August 2025 |
367.27 (0%) |
369.02 |
366.48 - 369.02 |
0.0849 times |
Fri 29 August 2025 |
367.27 (-0%) |
366.49 |
365.40 - 369.93 |
1.1841 times |
Fri 22 August 2025 |
367.28 (0.46%) |
364.92 |
359.56 - 368.05 |
0.988 times |

Monthly price and charts Russell3000 Strong monthly Stock price targets for Russell3000 IWV are 378.12 and 392.93 | Monthly Target 1 | 365.93 | | Monthly Target 2 | 375.5 | | Monthly Target 3 | 380.74333333333 | | Monthly Target 4 | 390.31 | | Monthly Target 5 | 395.55 |
Monthly price and volumes Russell 3000
| Date |
Closing |
Open |
Range |
Volume |
Fri 24 October 2025 |
385.06 (1.62%) |
377.14 |
371.18 - 385.99 |
0.7832 times |
Tue 30 September 2025 |
378.94 (3.18%) |
362.97 |
361.94 - 380.18 |
0.7477 times |
Fri 29 August 2025 |
367.27 (2.32%) |
355.27 |
351.69 - 369.93 |
0.6281 times |
Thu 31 July 2025 |
358.96 (2.27%) |
350.09 |
349.83 - 363.41 |
0.754 times |
Mon 30 June 2025 |
351.00 (4.81%) |
334.04 |
332.73 - 351.83 |
0.8689 times |
Fri 30 May 2025 |
334.88 (6.36%) |
318.27 |
316.48 - 338.65 |
1.2285 times |
Wed 30 April 2025 |
314.85 (-0.88%) |
316.56 |
273.60 - 322.75 |
1.8321 times |
Mon 31 March 2025 |
317.64 (-6.03%) |
339.18 |
310.85 - 339.81 |
1.1933 times |
Fri 28 February 2025 |
338.01 (-1.88%) |
338.86 |
331.67 - 350.23 |
0.7266 times |
Fri 31 January 2025 |
344.47 (3.06%) |
335.91 |
328.49 - 349.24 |
1.2376 times |
Tue 31 December 2024 |
334.25 (-3.11%) |
349.23 |
332.07 - 349.23 |
0.686 times |

DMA SMA EMA moving averages of Russell 3000 IWV
DMA (daily moving average) of Russell 3000 IWV
| DMA period | DMA value | | 5 day DMA | 382.09 | | 12 day DMA | 379.2 | | 20 day DMA | 379.7 | | 35 day DMA | 377.73 | | 50 day DMA | 374.31 | | 100 day DMA | 363.41 | | 150 day DMA | 347.82 | | 200 day DMA | 345.14 | EMA (exponential moving average) of Russell 3000 IWV
| EMA period | EMA current | EMA prev | EMA prev2 | | 5 day EMA | 382.06 | 380.56 | 379.78 | | 12 day EMA | 380.41 | 379.56 | 379.09 | | 20 day EMA | 379.27 | 378.66 | 378.3 | | 35 day EMA | 376.74 | 376.25 | 375.9 | | 50 day EMA | 374.33 | 373.89 | 373.55 |
SMA (simple moving average) of Russell 3000 IWV
| SMA period | SMA current | SMA prev | SMA prev2 | | 5 day SMA | 382.09 | 380.61 | 379.39 | | 12 day SMA | 379.2 | 379.03 | 378.88 | | 20 day SMA | 379.7 | 379.29 | 378.9 | | 35 day SMA | 377.73 | 377.28 | 376.92 | | 50 day SMA | 374.31 | 373.92 | 373.6 | | 100 day SMA | 363.41 | 362.93 | 362.46 | | 150 day SMA | 347.82 | 347.4 | 347 | | 200 day SMA | 345.14 | 344.9 | 344.67 |
|
|
